


Views
Downloads
Printable Ice Cream Graphing Worksheet | Grade 2 Math
Paste this activity's link or code into your existing LMS (Google Classroom, Canvas, Teams, Schoology, Moodle, etc.).
Students can open and work on the activity right away, with no student login required.
You'll still be able to track student progress and results from your teacher account.
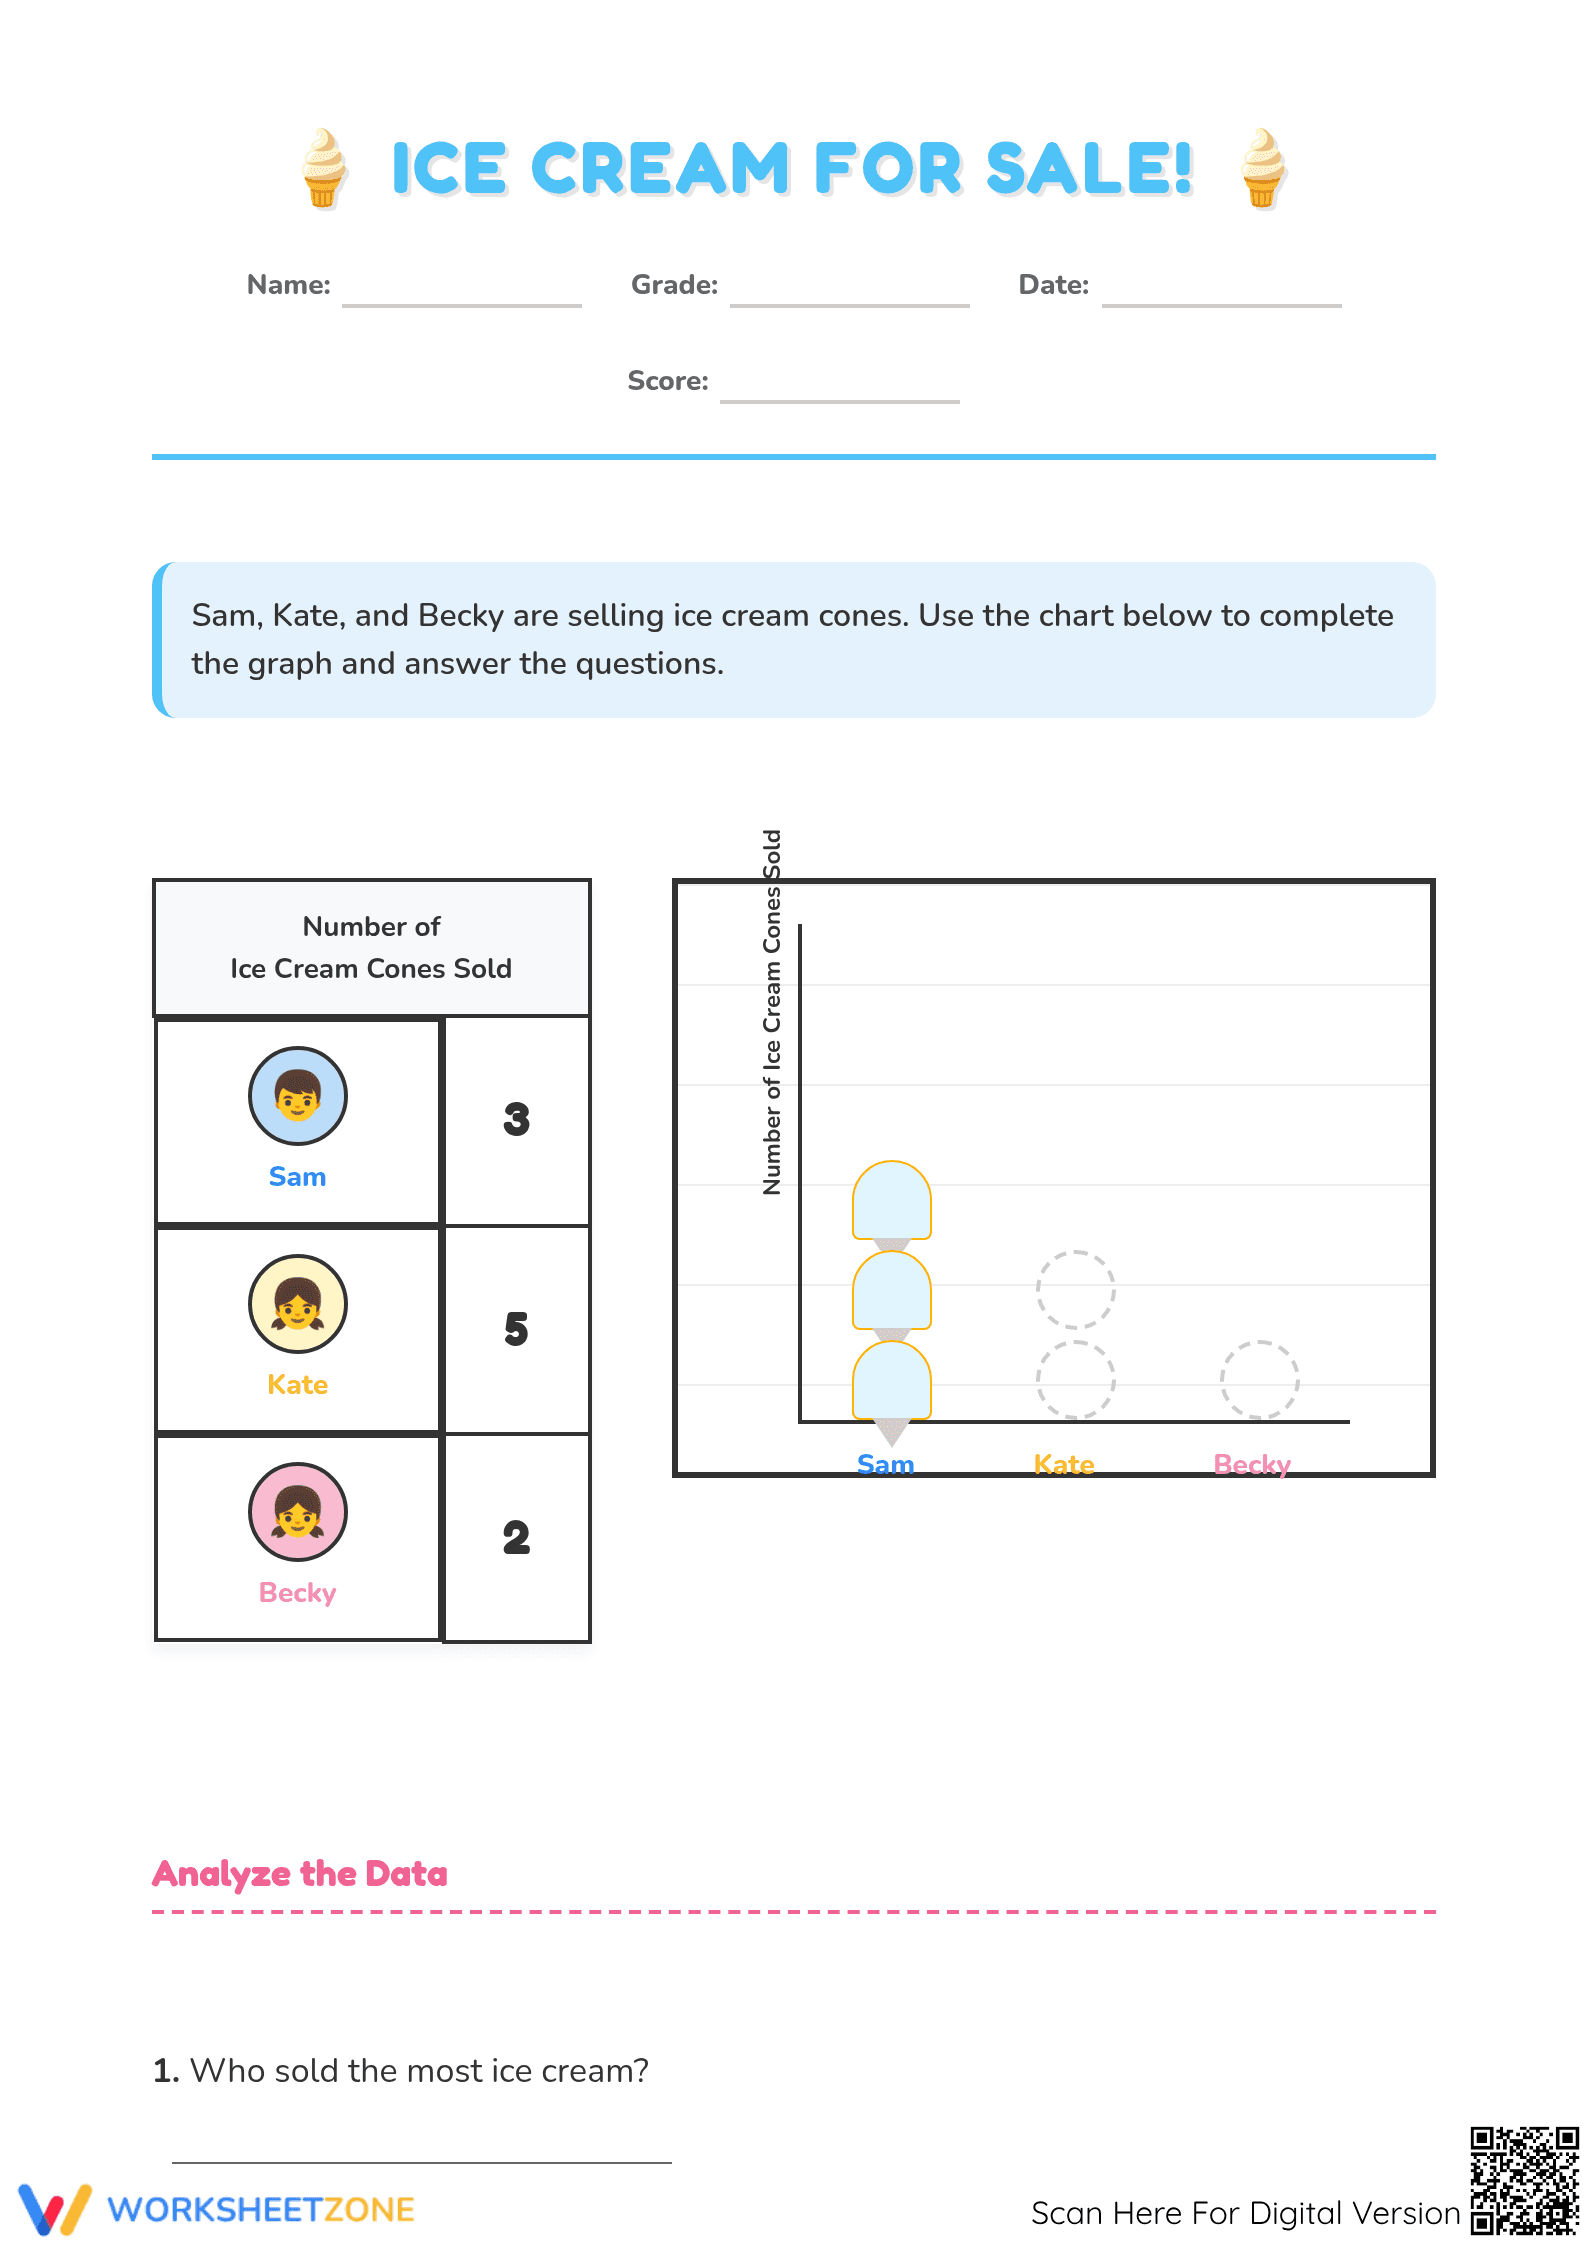
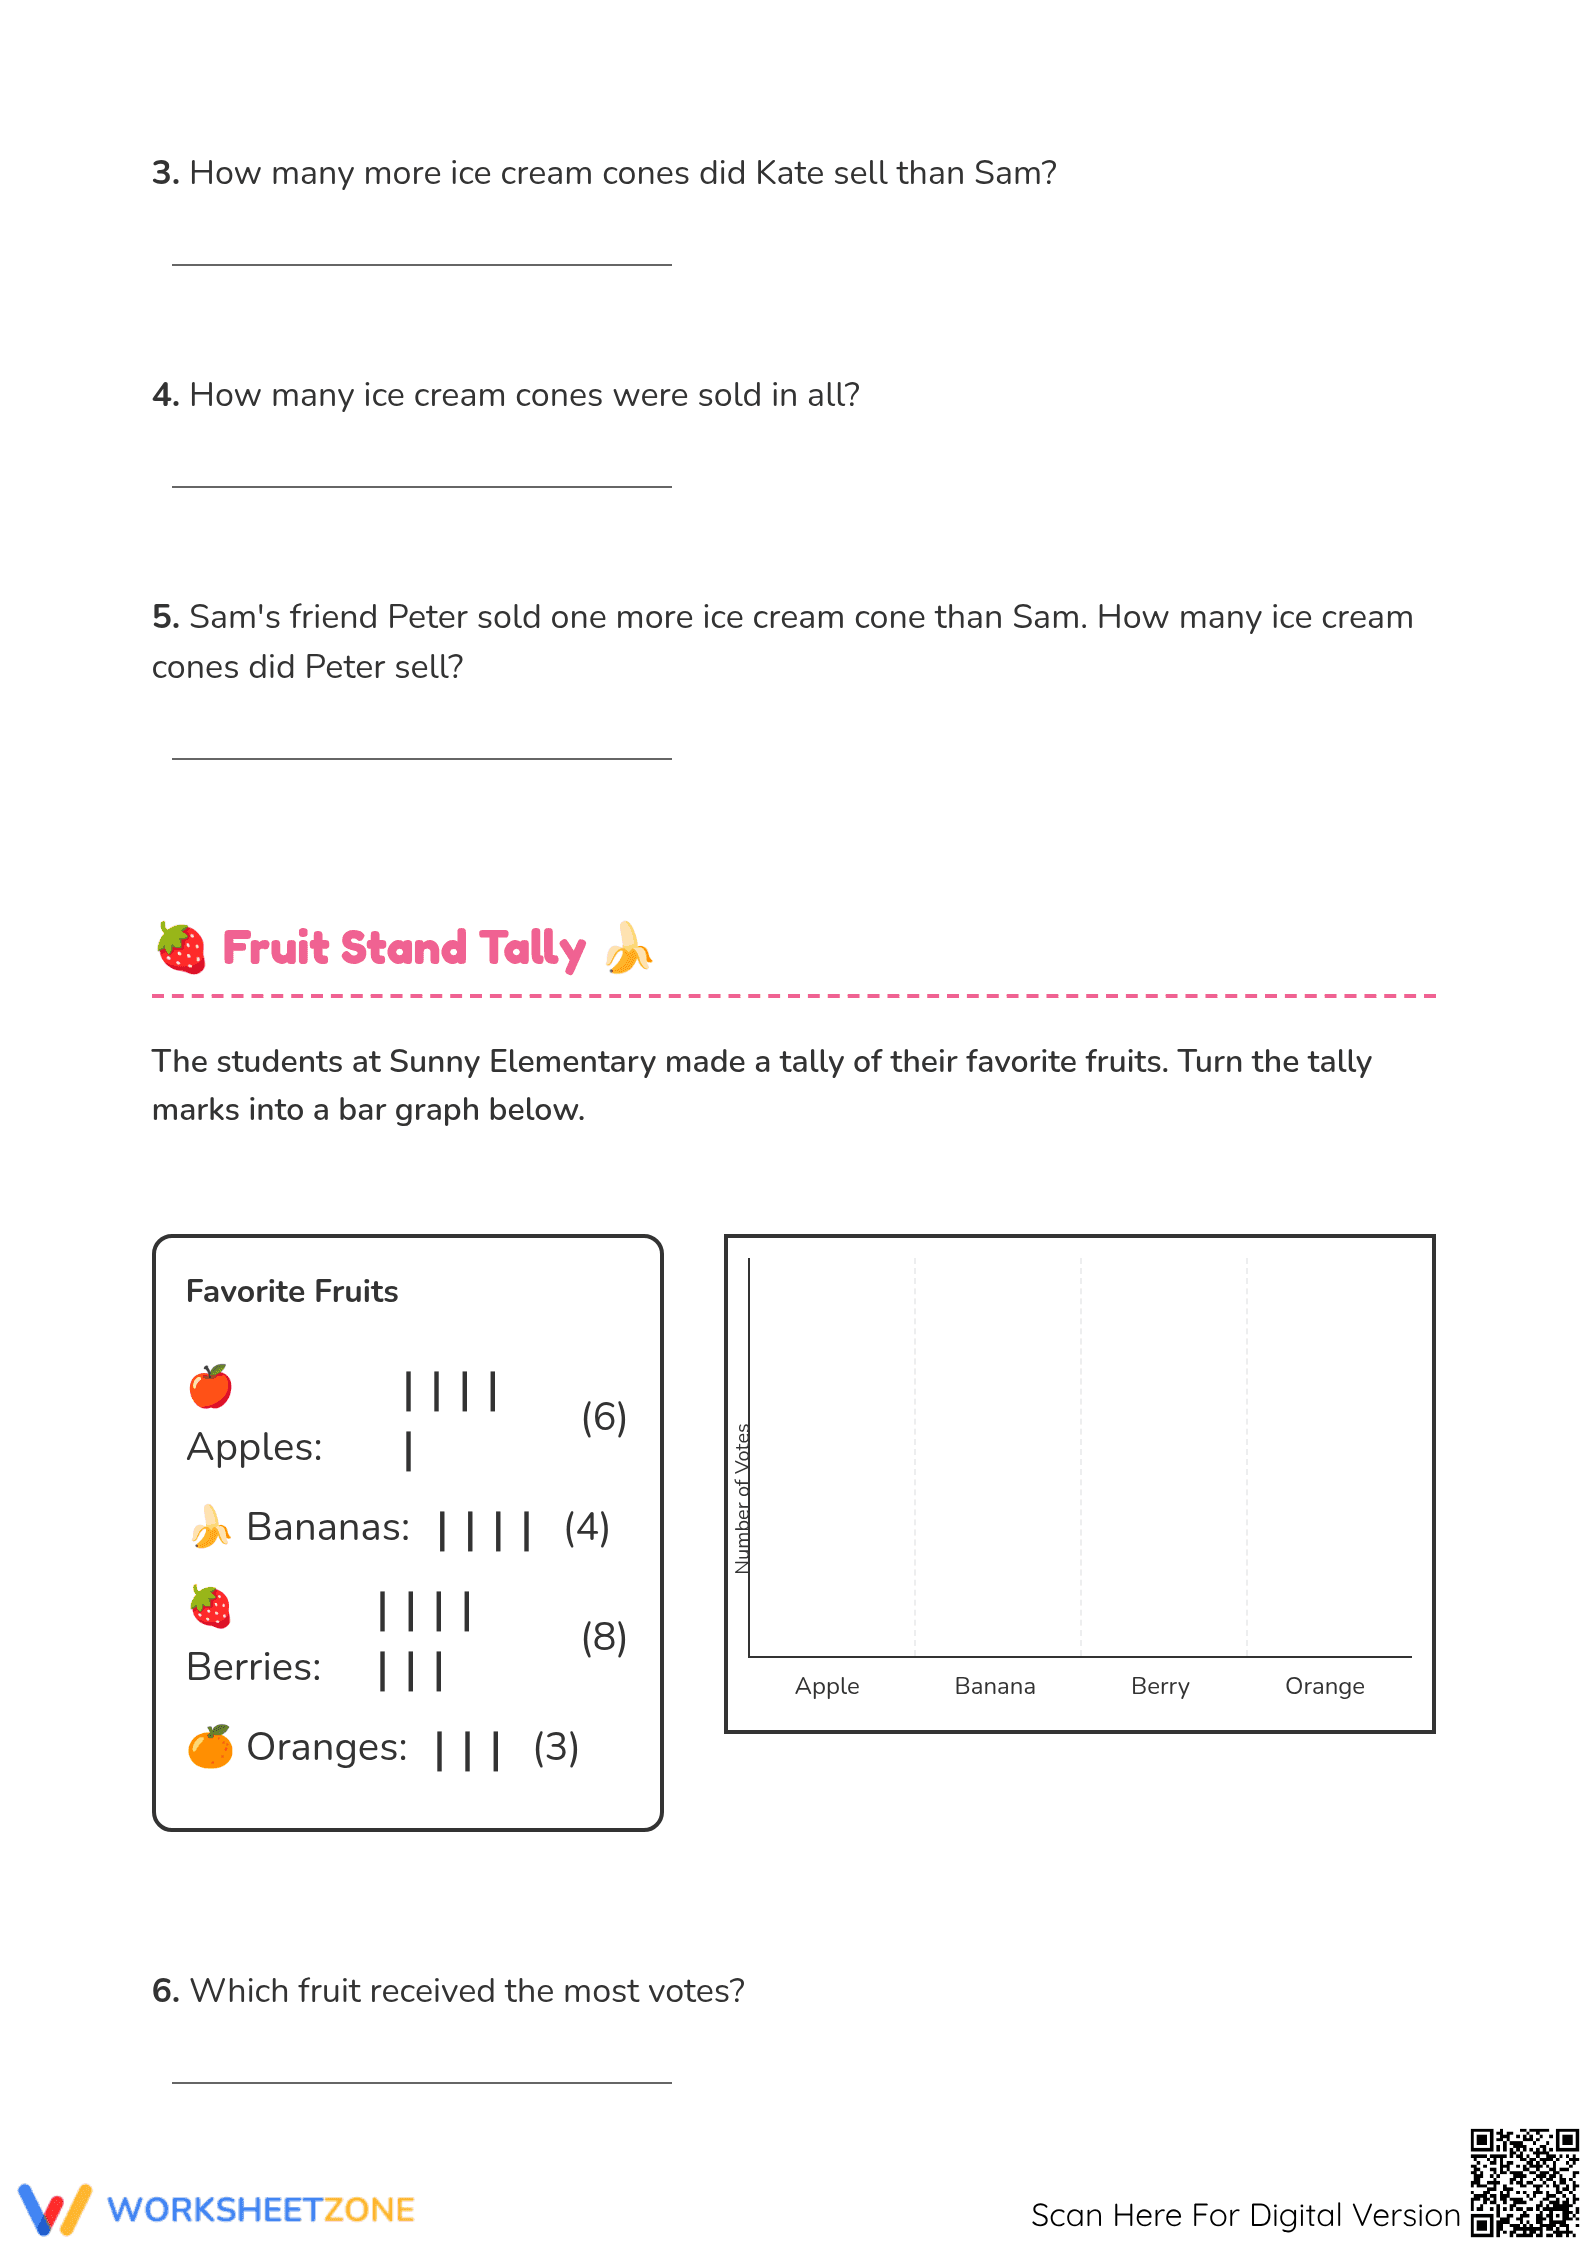
This Grade 2 graphing worksheet transforms data collection into an engaging retail scenario where students track ice cream sales and fruit preferences. By completing pictographs and bar graphs, learners develop the essential ability to organize information visually and extract meaningful insights from structured datasets. It provides a comprehensive bridge between raw tallying and analytical reasoning.
At a Glance
- Grade: 2 · Subject: Math
- Standard:
CCSS.MATH.CONTENT.2.MD.D.10— Draw picture and bar graphs to represent data and solve comparison problems- Skill Focus: Data organization and interpretation
- Format: 3 pages · 10 problems · Answer key included · PDF
- Best For: Morning work or independent center practice
- Time: 20–30 minutes
Inside this 3-page PDF, you will find two distinct data scenarios. The first page features a "Ice Cream For Sale" pictograph where students must draw symbols to represent sales for Sam, Kate, and Becky. The following pages introduce a "Fruit Stand Tally" task, requiring students to convert tally marks into a functional bar graph. A complete answer key is provided for rapid grading.
This worksheet is designed for a zero-prep classroom workflow that maximizes instructional time. First, print the three-page set for your students (under 1 minute). Second, distribute the packets during your data and measurement block; the self-explanatory instructions mean students can begin immediately. Finally, review the eight analytical questions together using the provided answer key to identify common misconceptions in under 5 minutes.
This resource is directly aligned to `CCSS.MATH.CONTENT.2.MD.D.10`. Students must draw a picture graph and a bar graph to represent a data set with up to four categories. It also supports the broader measurement and data strand by emphasizing the organization of information. Both standard codes can be copied directly into lesson plans, IEP goals, or district curriculum mapping tools.
Use this worksheet as a summative assessment after introducing the concepts of pictographs and bar graphs. It serves as an excellent formative check to see if students can accurately translate tally marks into bar heights. While students work, observe if they correctly align the ice cream symbols in the pictograph; this is a key indicator of their understanding of one-to-one correspondence during completion.
This resource is ideal for Grade 2 students but also serves as a valuable extension for advanced 1st graders or a remedial tool for 3rd graders. The clear layout and familiar themes of ice cream and fruit support English Language Learners by providing strong visual cues for the mathematical tasks. It pairs naturally with a hands-on classroom survey activity or anchor chart.
Effective data literacy in early childhood education relies on the transition from concrete objects to abstract representations. Research from Fisher & Frey (2014) emphasizes the importance of the gradual release of responsibility, which this worksheet facilitates through structured graphing prompts. By requiring students to not only draw the graphs but also answer complex "how many more" comparison questions, the activity addresses the cognitive demands of CCSS.MATH.CONTENT.2.MD.D.10. Studies such as the RAND AIRS 2024 report highlight that students who engage with multi-modal data representations—such as switching between tallies, pictographs, and bar graphs—demonstrate a 15% higher retention rate in algebraic thinking tasks. This worksheet provides that exact multi-modal experience, ensuring students can accurately interpret data and explain its significance. It is a robust tool for building the foundational skills necessary for later statistical analysis and complex problem-solving in mathematics.