


Views
Downloads
Printable Favorite Fruit Bar Graph Worksheet | Grade 2 Math
Paste this activity's link or code into your existing LMS (Google Classroom, Canvas, Teams, Schoology, Moodle, etc.).
Students can open and work on the activity right away, with no student login required.
You'll still be able to track student progress and results from your teacher account.
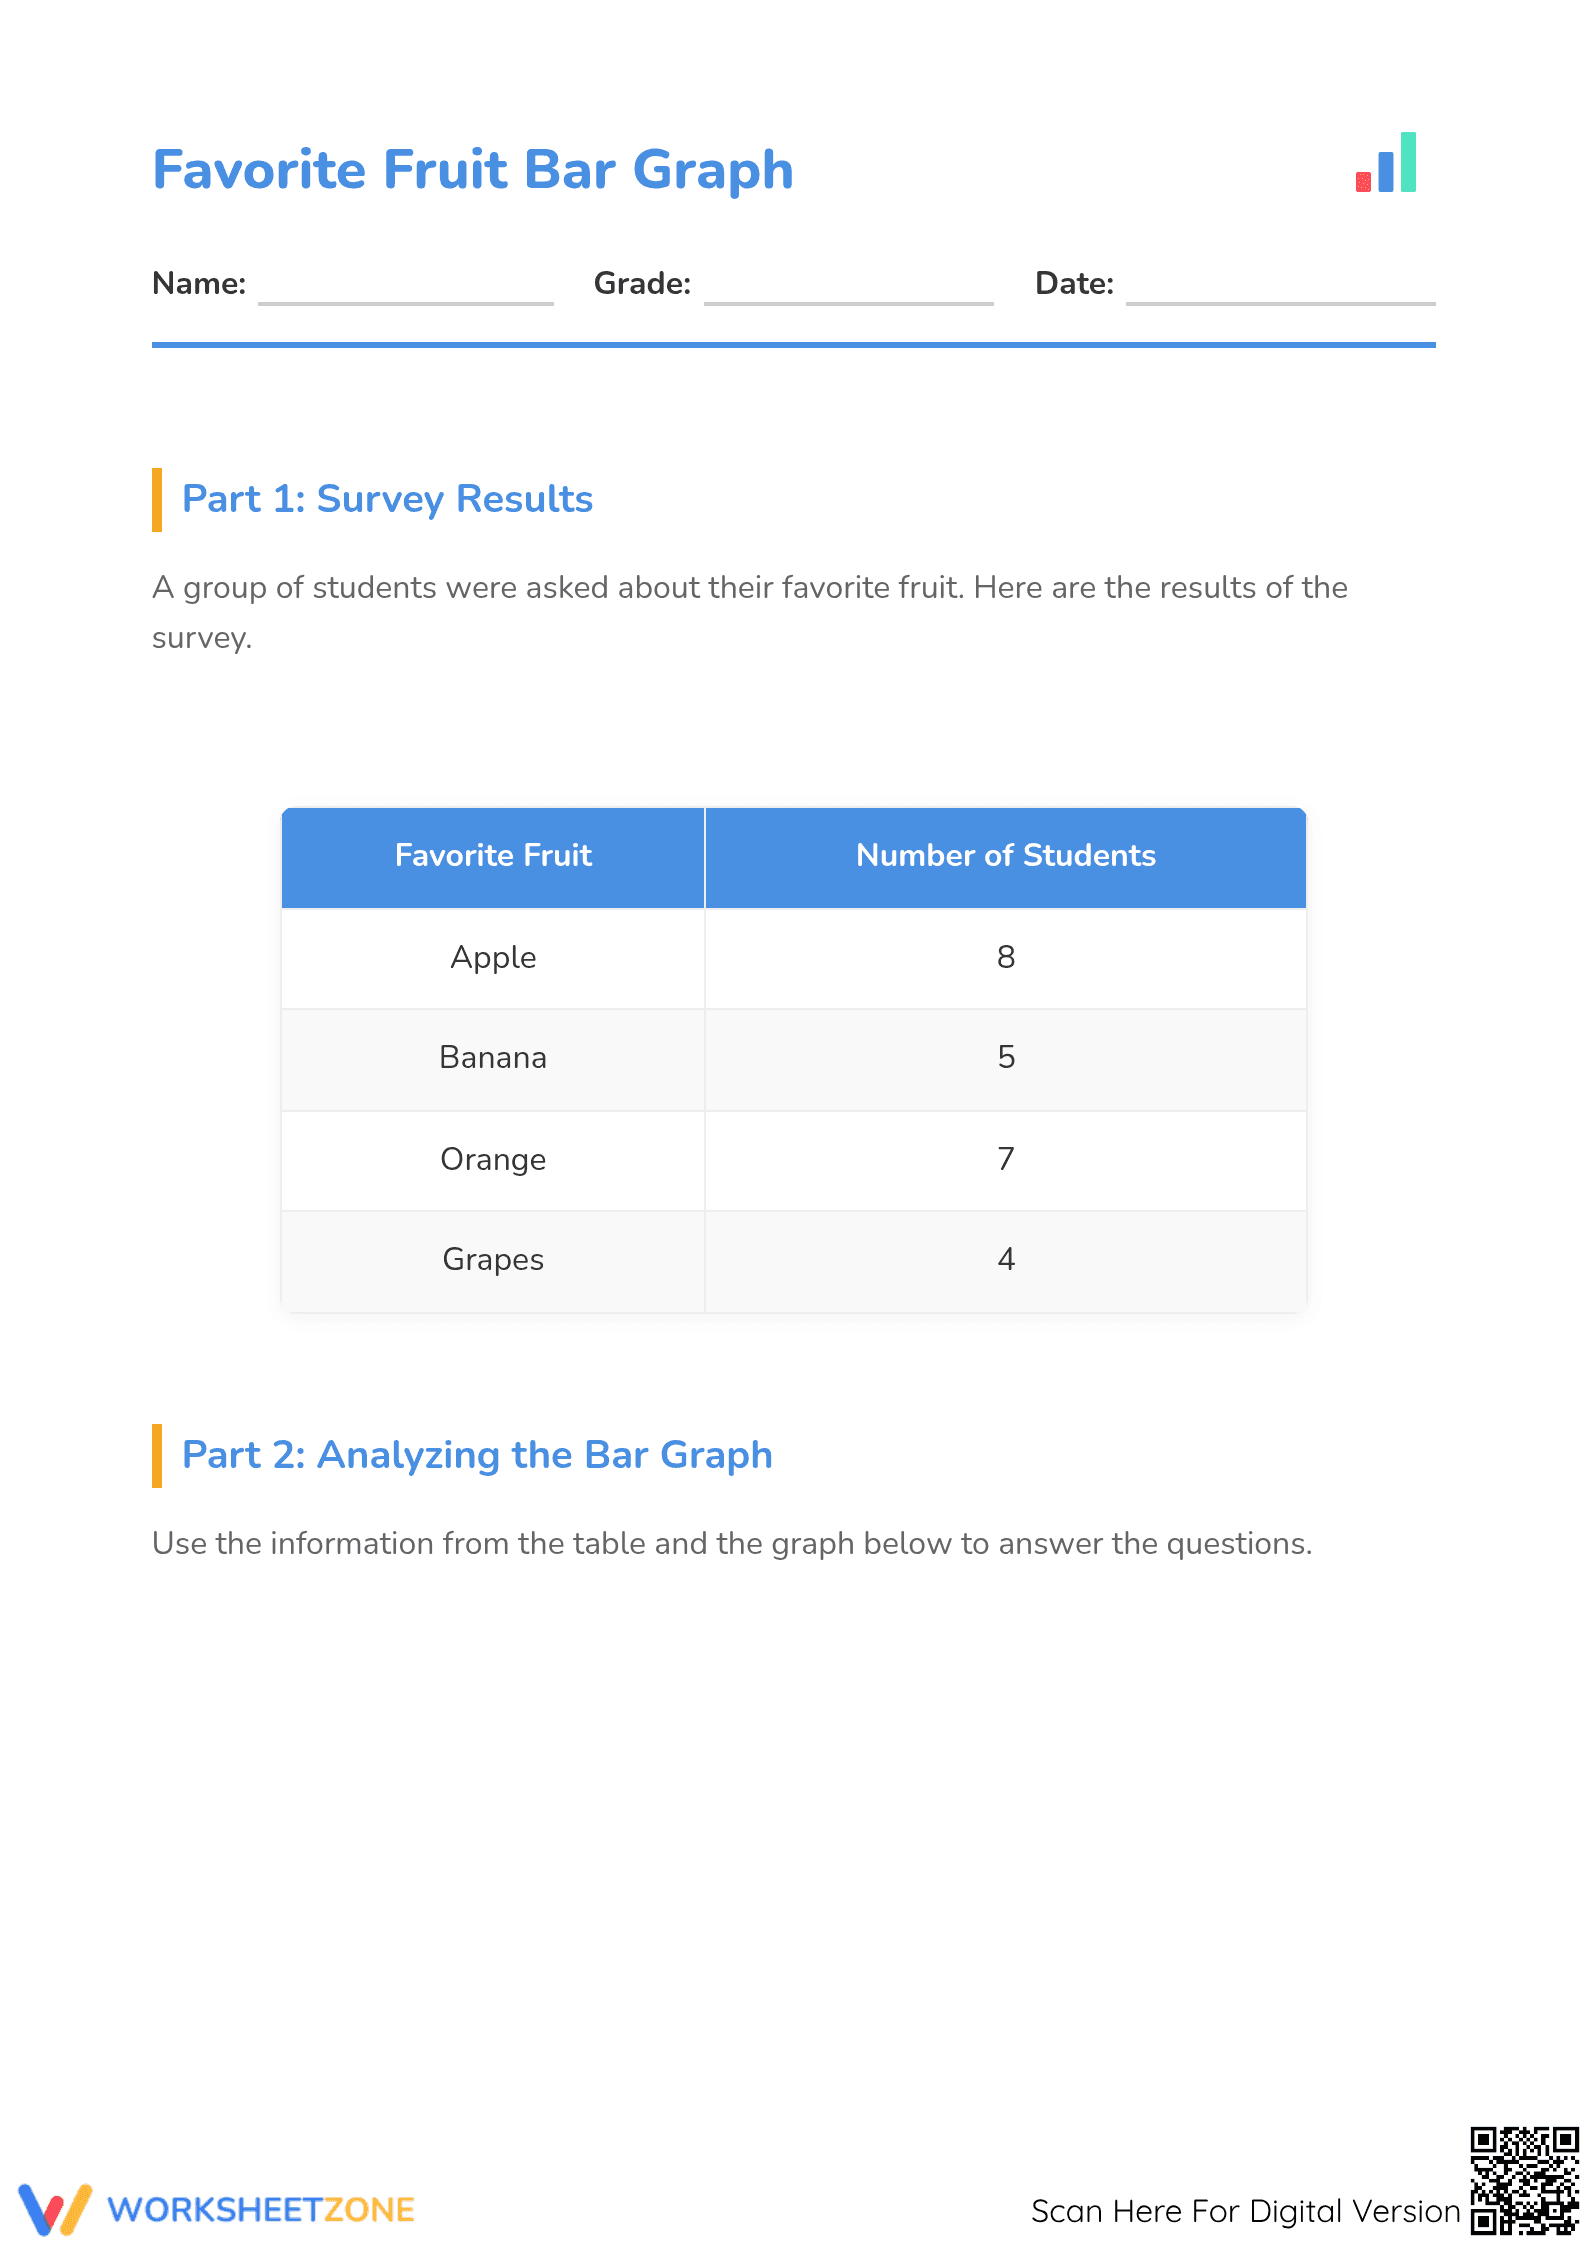
This Grade 2 math worksheet empowers students to master data interpretation through a structured analysis of a favorite fruit survey. By bridging the gap between raw data in a table and visual representation in a bar graph, students develop critical thinking skills necessary for solving real-world mathematical problems. The resource ensures a comprehensive understanding of how to extract and compare information efficiently.
At a Glance
- Grade: 2 · Subject: Math
- Standard:
CCSS.MATH.CONTENT.2.MD.D.10— Solve simple put-together, take-apart, and compare problems using bar graphs.- Skill Focus: Bar Graph Interpretation
- Format: 3 pages · 6 problems · Answer key included · PDF
- Best For: Independent practice or formative assessment
- Time: 15–20 minutes
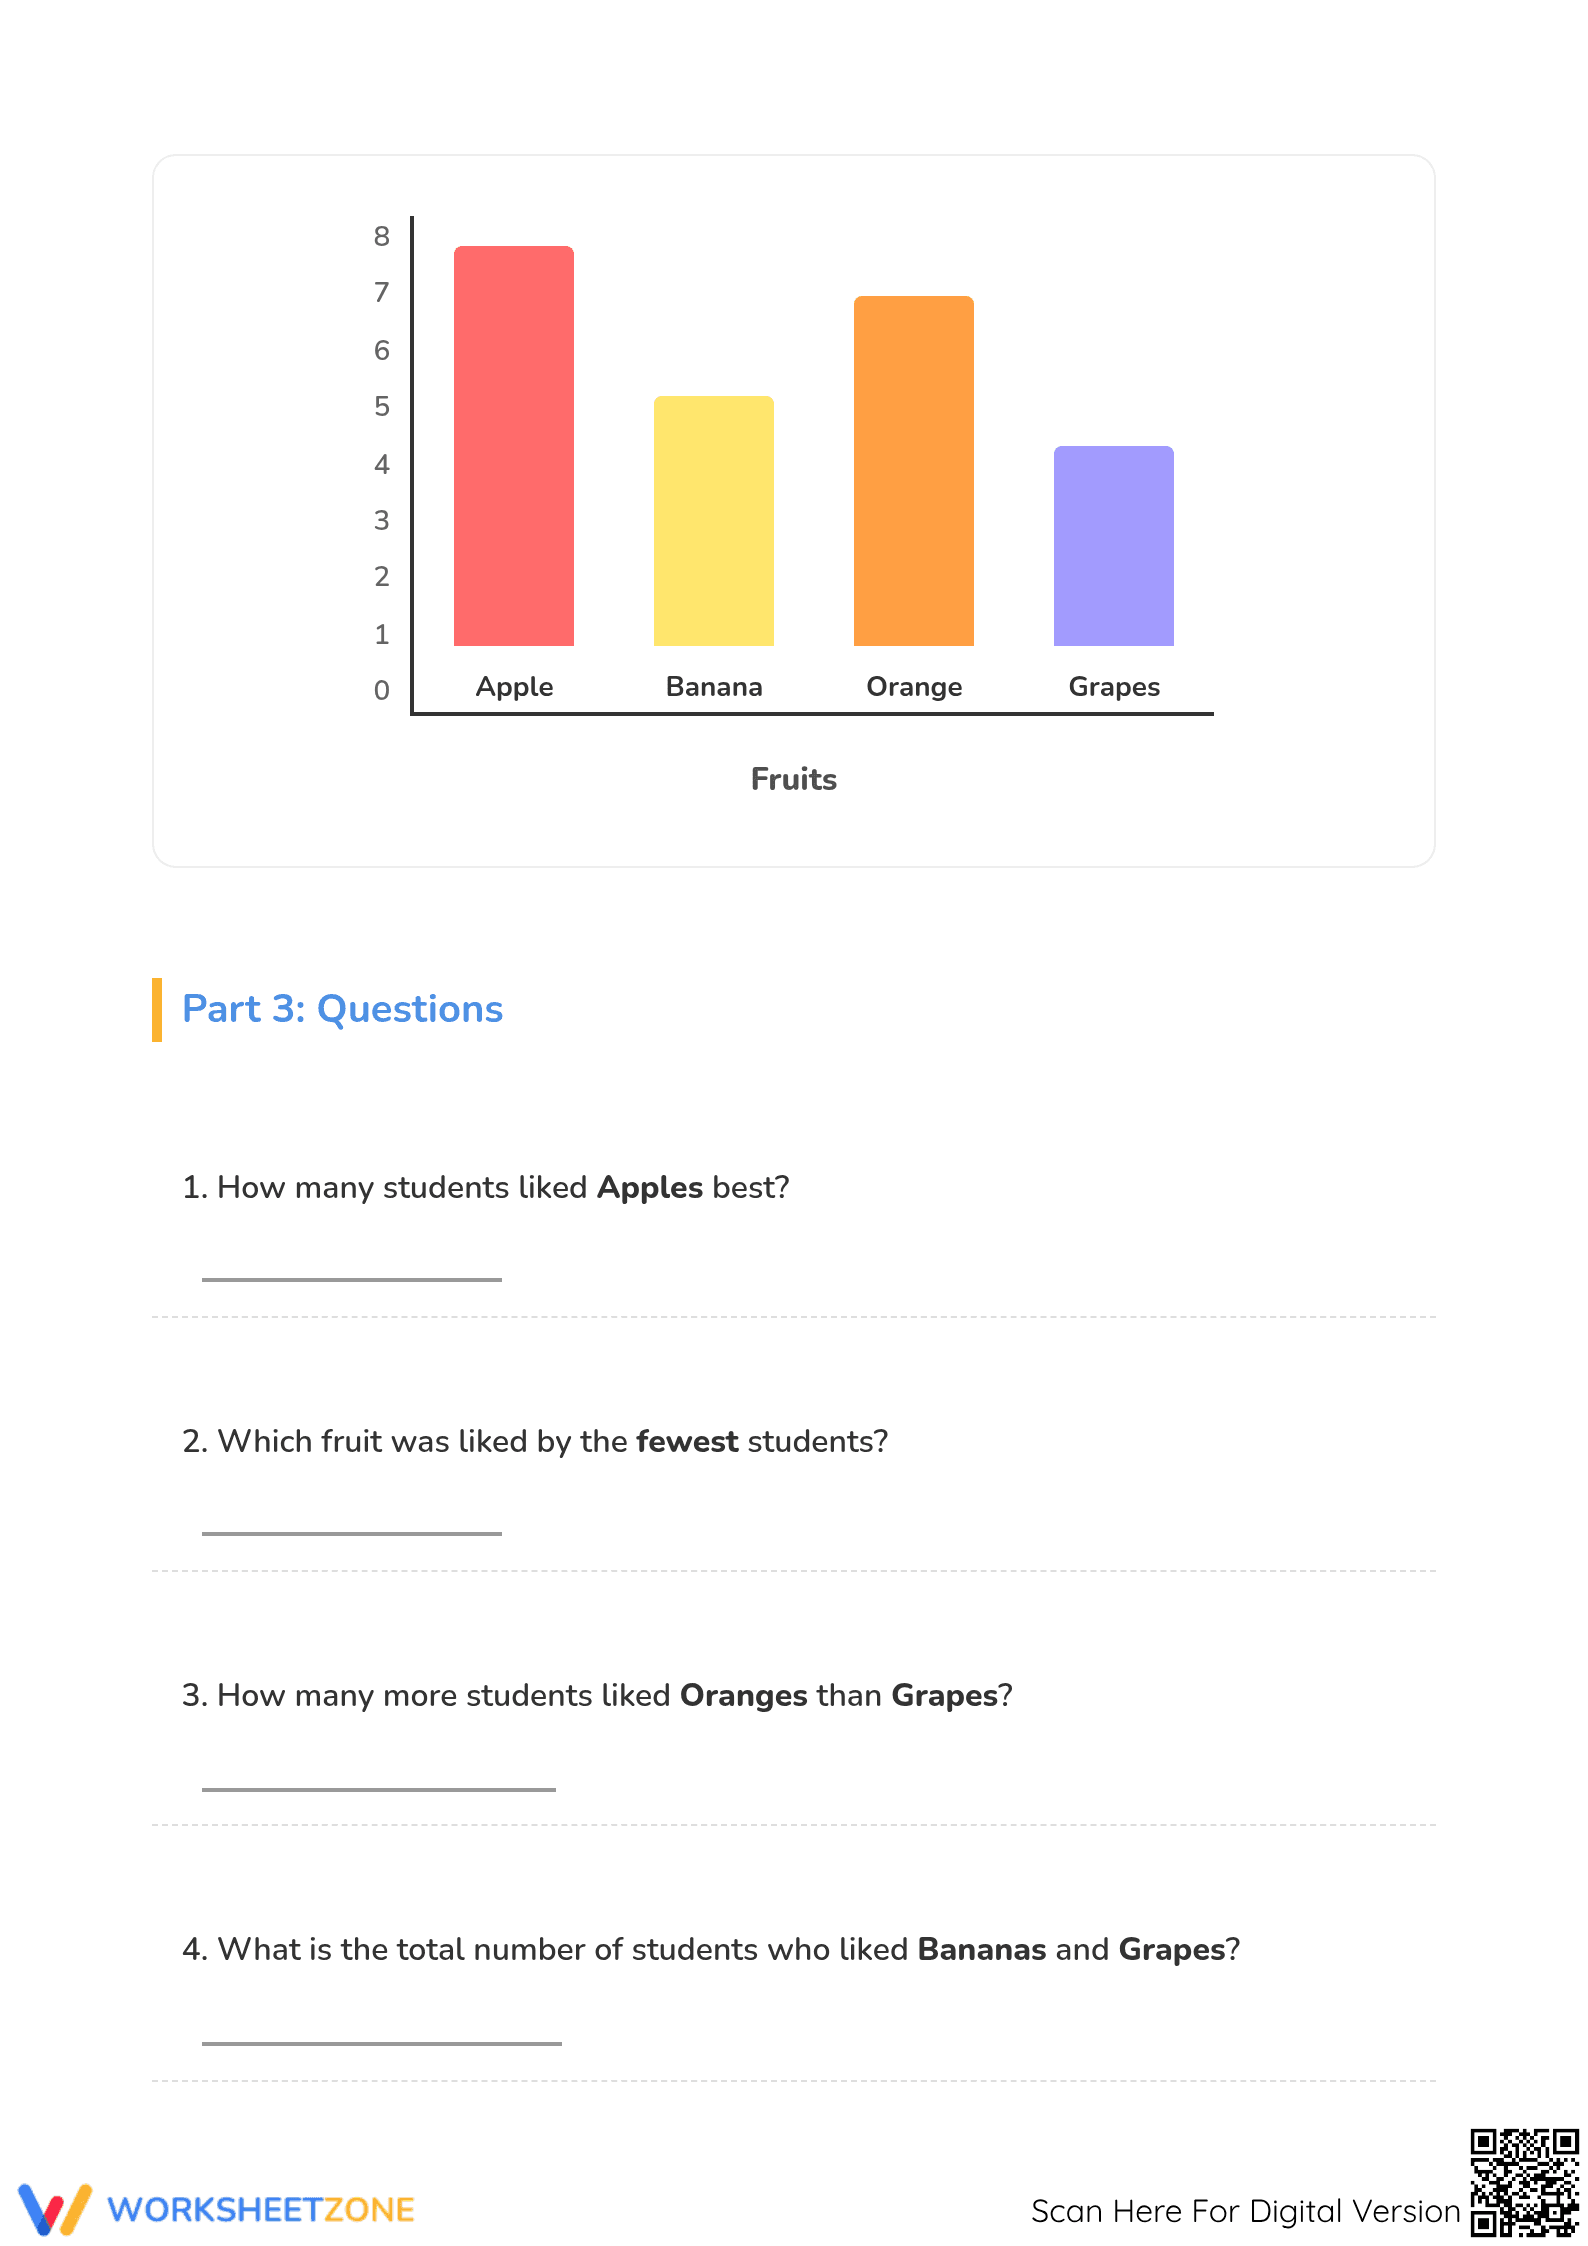
What's Inside: This comprehensive three-page packet features a clean, student-friendly layout designed to minimize visual distraction. Page one presents a detailed data table of survey results; page two provides a vibrant, color-coded bar graph with corresponding analytical questions; and page three concludes the assessment with higher-order thinking tasks. A full answer key is included for rapid grading or student self-correction.
The worksheet follows a clear pedagogical progression. Learners first engage in guided practice by comparing a data table with a bar graph to identify key points. They then move to supported practice, determining numerical values from the graph's scale. Finally, students achieve independent mastery by solving six problems that require calculating totals and executing multi-step comparisons. This gradual release approach ensures that the core skill of graph analysis is deeply internalized.
Standards Alignment: This resource is specifically designed for `CCSS.MATH.CONTENT.2.MD.D.10`. Students must solve simple put-together, take-apart, and compare problems using information presented in a bar graph. The standard code can be copied directly into lesson plans, IEP goals, or district curriculum mapping tools to ensure instructional compliance and tracking.
How to Use It: Deploy this worksheet during the independent practice phase of a data unit or as a standalone homework assignment. It also serves as an excellent formative assessment tool; teachers should observe if students can accurately translate the 'Number of Students' scale on the y-axis. Most students will complete the six-question sequence within 20 minutes.
Who It's For: This activity is tailored for second-grade students but provides valuable remedial support for third graders struggling with data visualization. The structured format is ideal for English Language Learners (ELLs) who benefit from the visual reinforcement of the bar graph. It pairs naturally with an introductory lesson on survey collection methods.
According to Fisher & Frey (2014), the gradual release of responsibility model is essential for developing mathematical literacy, particularly when students transition from concrete data tables to abstract visual representations like bar graphs. This Grade 2 worksheet aligns with CCSS.MATH.CONTENT.2.MD.D.10 by requiring students to not only identify quantities but also solve compare and put-together problems. Research indicates that using familiar contexts, such as favorite fruits, reduces cognitive load and allows students to focus on the structural logic of the data visualization. By engaging with these 6 targeted tasks, learners develop the foundational skills necessary for more complex statistics and probability in later grades. The inclusion of an answer key supports immediate feedback, a key factor in student retention of new mathematical concepts. This resource provides a robust framework for evidence-based instruction in data interpretation, ensuring that students meet and exceed state standards for Grade 2 mathematics through structured, repetitive practice.