


Views
Downloads
Printable Bar Graph Analysis Worksheet | Grade 3 Math
Paste this activity's link or code into your existing LMS (Google Classroom, Canvas, Teams, Schoology, Moodle, etc.).
Students can open and work on the activity right away, with no student login required.
You'll still be able to track student progress and results from your teacher account.
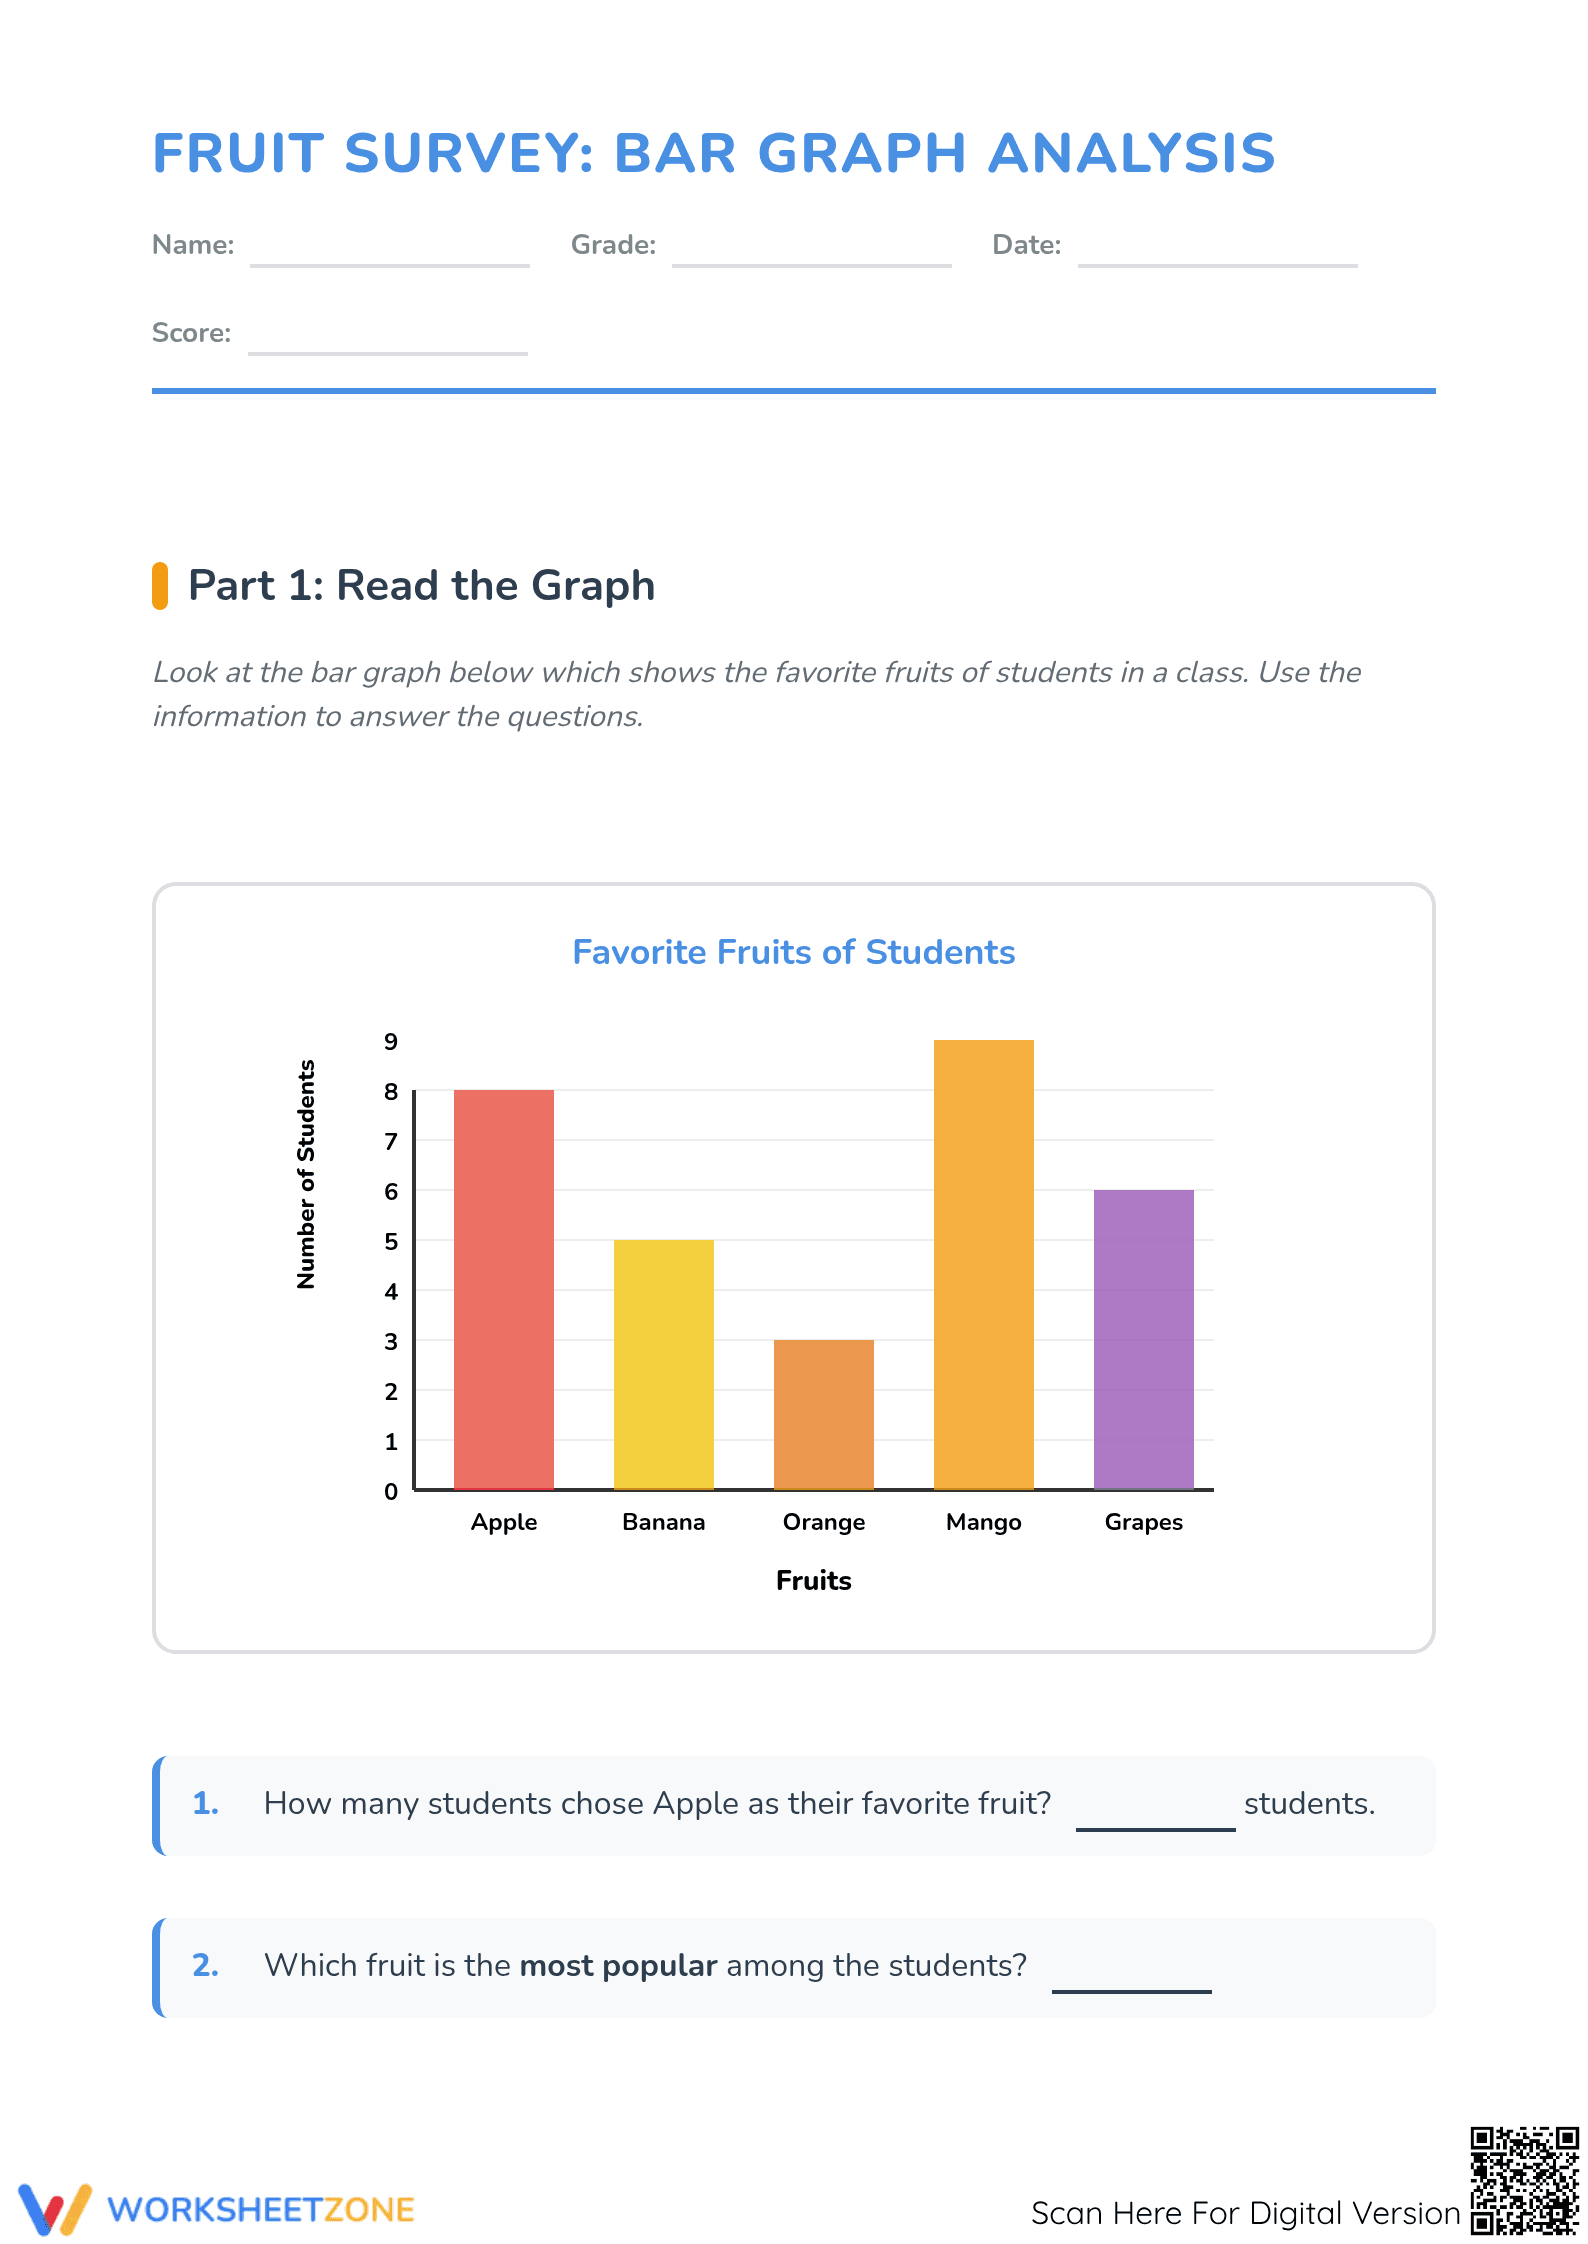
This Grade 3 math worksheet provides comprehensive practice in bar graph analysis and construction through engaging real-world surveys. Students first interpret a fruit survey graph to answer comparative questions before transcribing pet survey data into their own visual representation. This structured approach ensures students master data visualization while meeting core requirements.
At a Glance
- Grade: 3 · Subject: Math
- Standard:
3.MD.B.3— Draw and interpret scaled bar graphs to solve one- and two-step data problems.- Skill Focus: Bar Graph Interpretation & Construction
- Format: 3 pages · 10 problems · Answer key included · PDF
- Best For: Small group instruction or formative assessment
- Time: 25–35 minutes
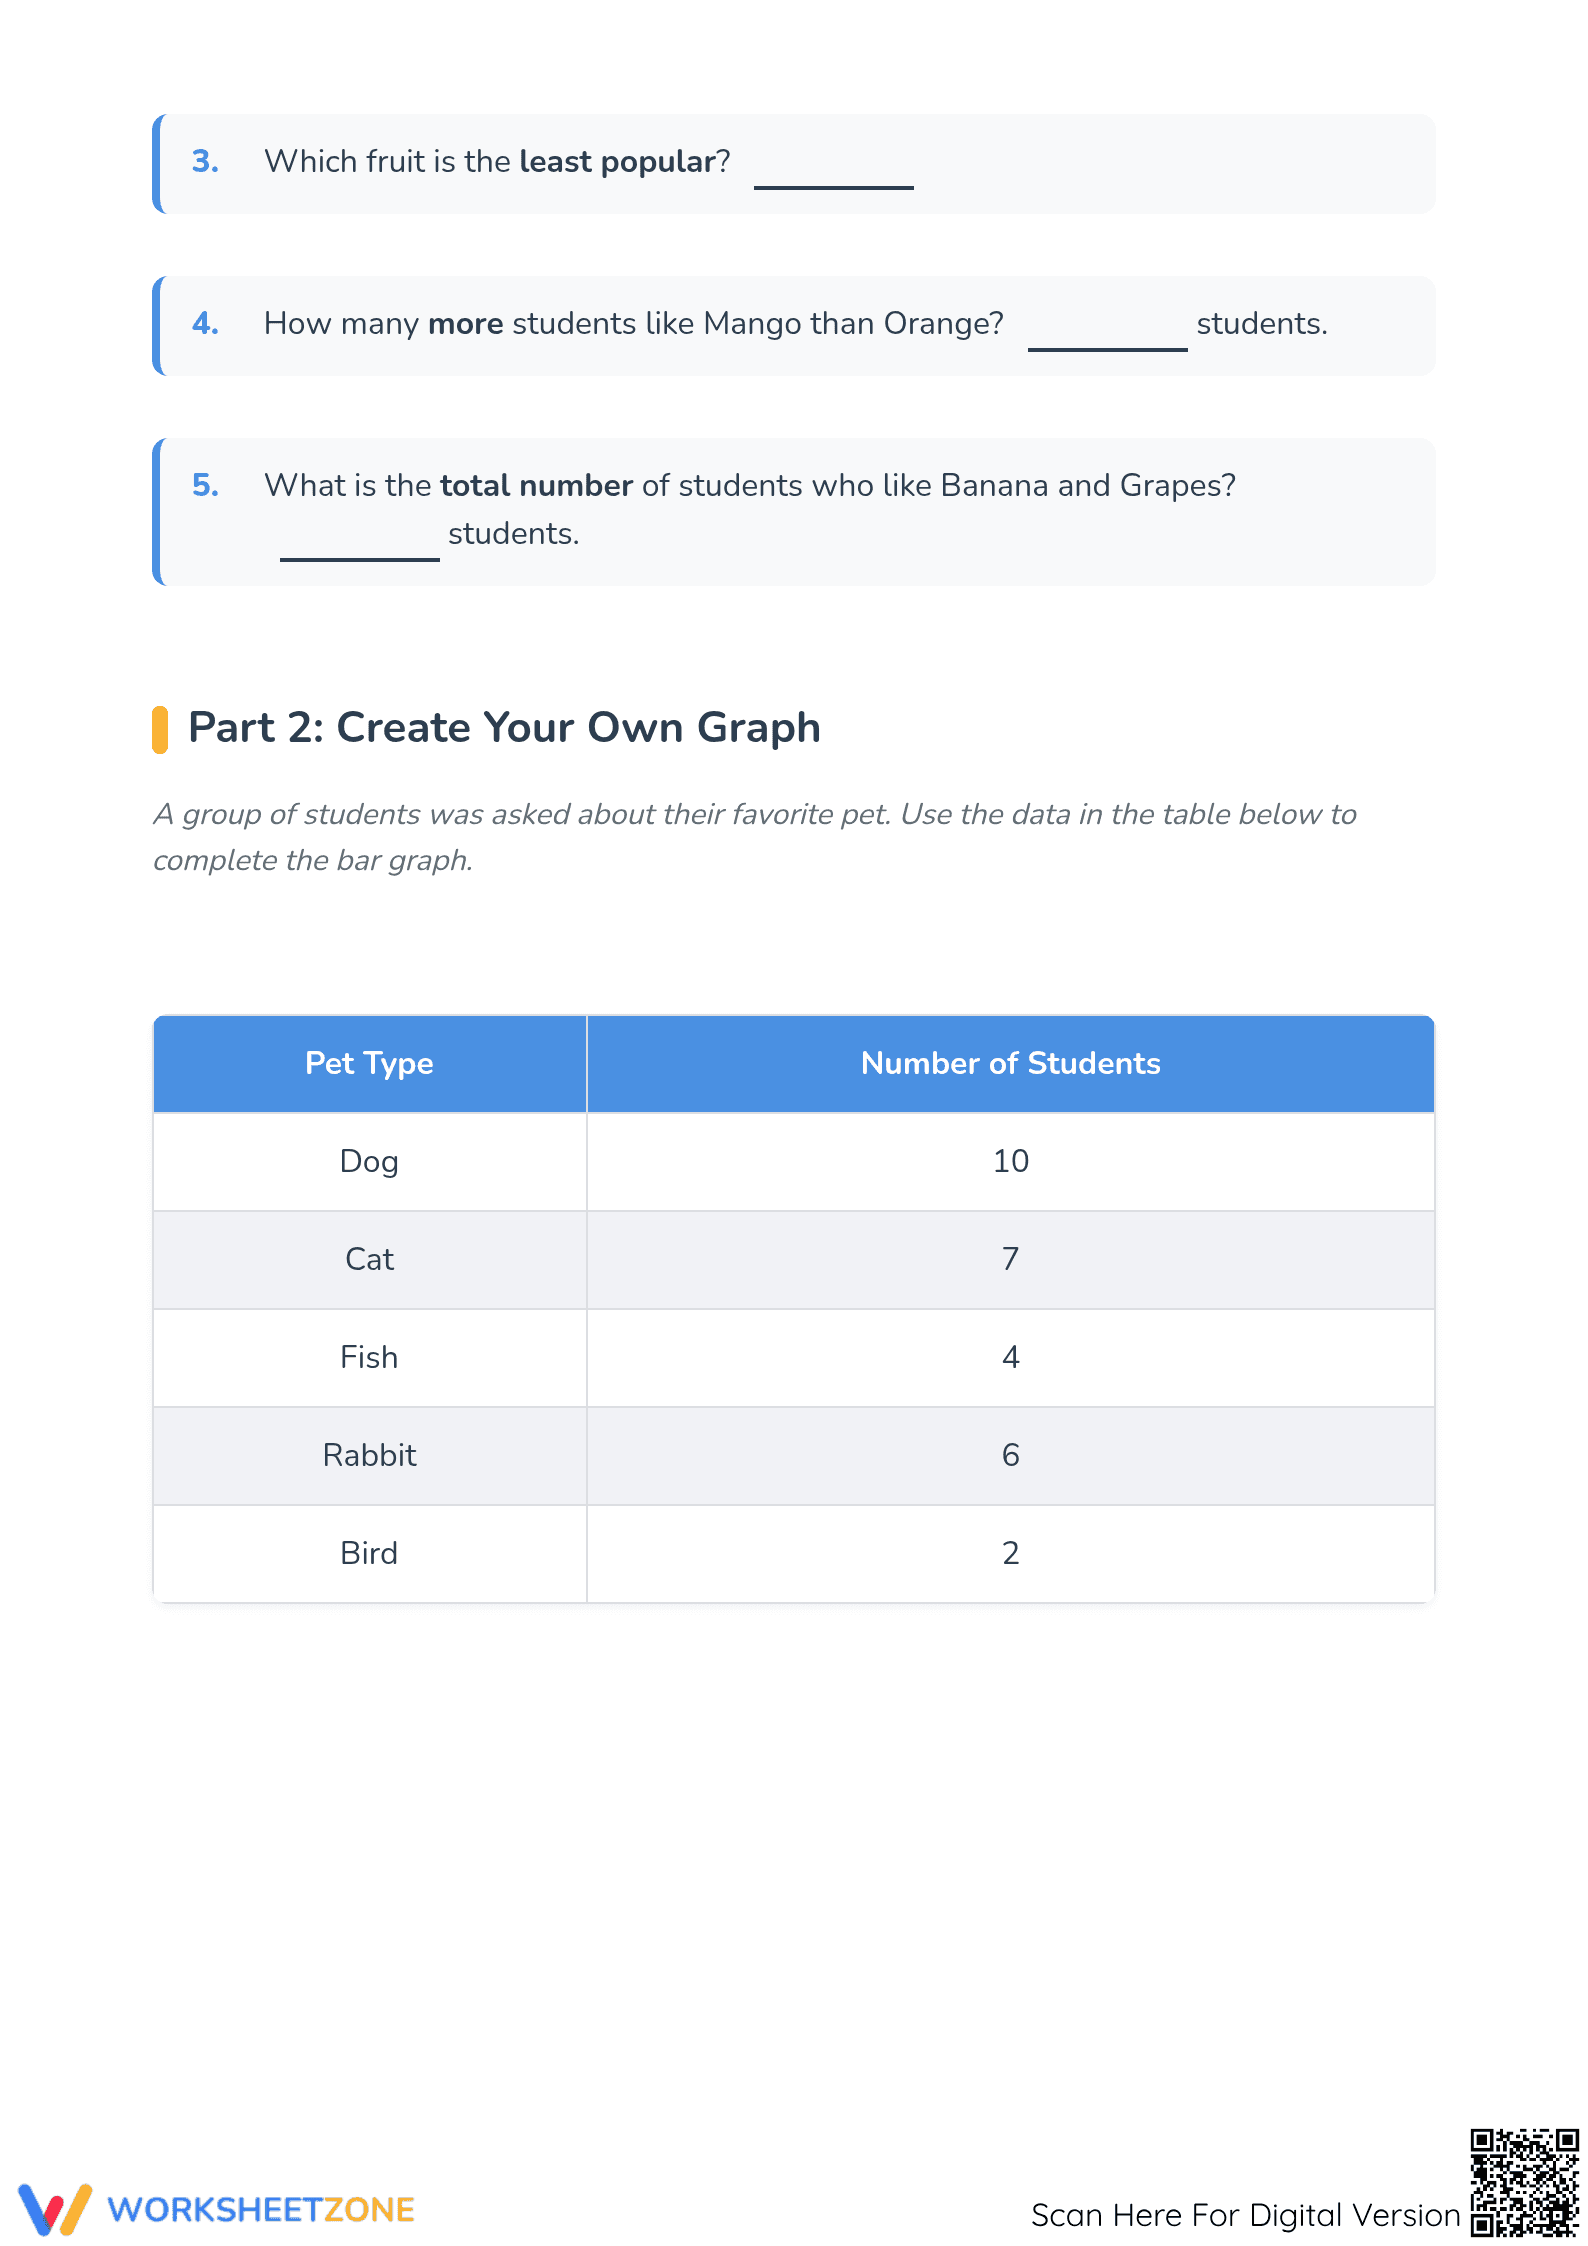
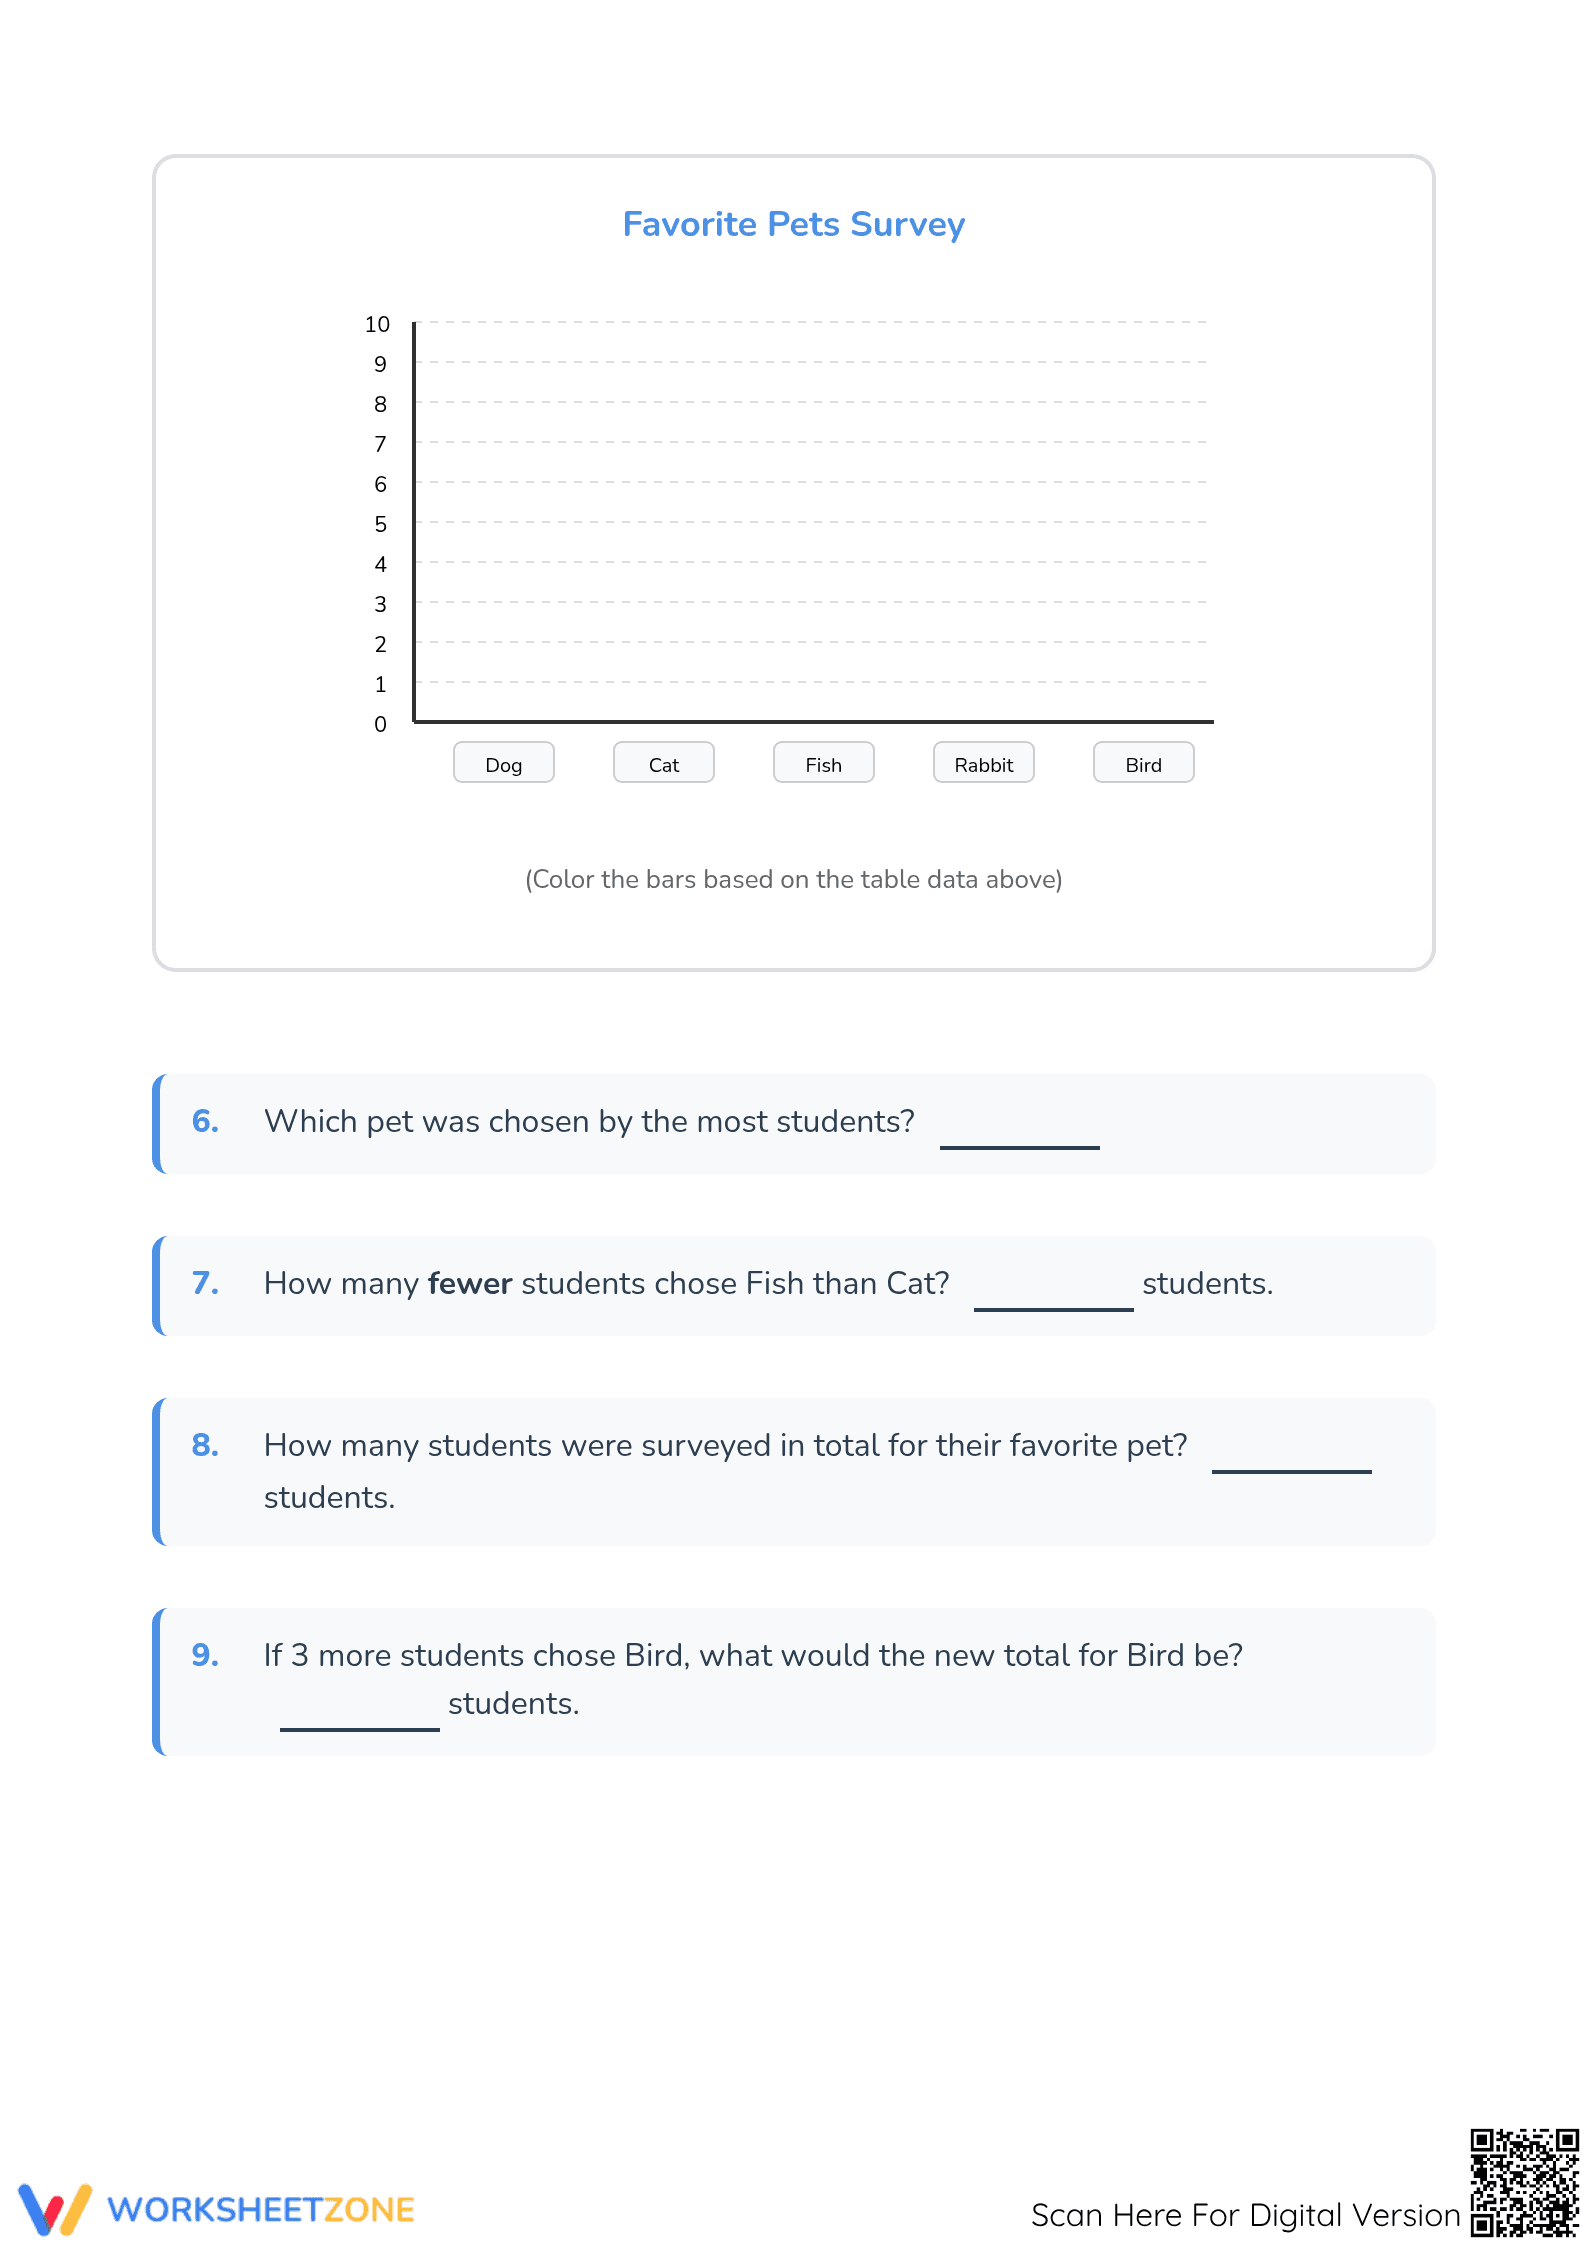
The package includes three high-quality PDF pages designed for student engagement. The first two pages focus on reading a multi-category fruit survey bar graph, featuring five word problems requiring addition and subtraction to solve "how many more" questions. The final page provides a pet survey data table and a blank grid for independent graph construction. A full answer key is included.
Skill Progression
- Guided Practice: Students identify specific values on a pre-made graph to build confidence in axis reading and data identification.
- Supported Practice: This section introduces comparative analysis, asking students to calculate differences and find sums across multiple fruit categories.
- Independent Practice: The final page requires students to translate raw table data into a correctly scaled bar graph, applying their mastery of labels and intervals.
This gradual-release model follows the I Do, We Do, You Do philosophy, ensuring students move from passive observation to active data modeling.
Standards Alignment
This resource is directly aligned with 3.MD.B.3: "Draw a scaled picture graph and a scaled bar graph to represent a data set with several categories. Solve one- and two-step 'how many more' and 'how many less' problems using information presented in scaled bar graphs." It also supports standard 2.MD.D.10 by reinforcing the foundational skills of representing data sets with up to four or more categories. Both standard codes can be copied directly into lesson plans, IEP goals, or district curriculum mapping tools.
How to Use It
Incorporate this worksheet during the "elaborate" phase of a data unit. For best results, use the fruit survey as a partner activity during direct instruction to observe how students handle the "how many more" phrasing, which is a common stumbling block. The pet survey section serves as an excellent formative assessment at the end of the lesson to verify if students can independently scale and label a graph. Expect students to complete the full three-page set in approximately 30 minutes.
Who It's For
This resource is ideal for Grade 3 general education students, but its clear visual structure makes it a valuable tool for Grade 4 students requiring RTI support or Grade 2 students ready for enrichment. It pairs naturally with a classroom "Favorite Snacks" live survey or a digital graphing tool to bridge the gap between paper-based and digital literacy. The inclusion of clear line intervals supports students with visual processing needs.
Research highlights that integrating data visualization tasks significantly improves student retention of abstract arithmetic concepts by providing concrete spatial context. This worksheet fosters this by guiding students from interpreting existing bar graphs to constructing their own, aligning with the gradual release of responsibility model. This approach ensures students internalize data scales and comparative logic, building crucial statistical reasoning skills for future success.