


1 / 7
0
Views
0
Downloads


0.0
0
Save
0 Likes
Honors Chemistry: Heating Cooling Curve of Water
0 Views
0 Downloads
Paste this activity's link or code into your existing LMS (Google Classroom, Canvas, Teams, Schoology, Moodle, etc.).
Students can open and work on the activity right away, with no student login required.
You'll still be able to track student progress and results from your teacher account.
Information
Description
What It Is:
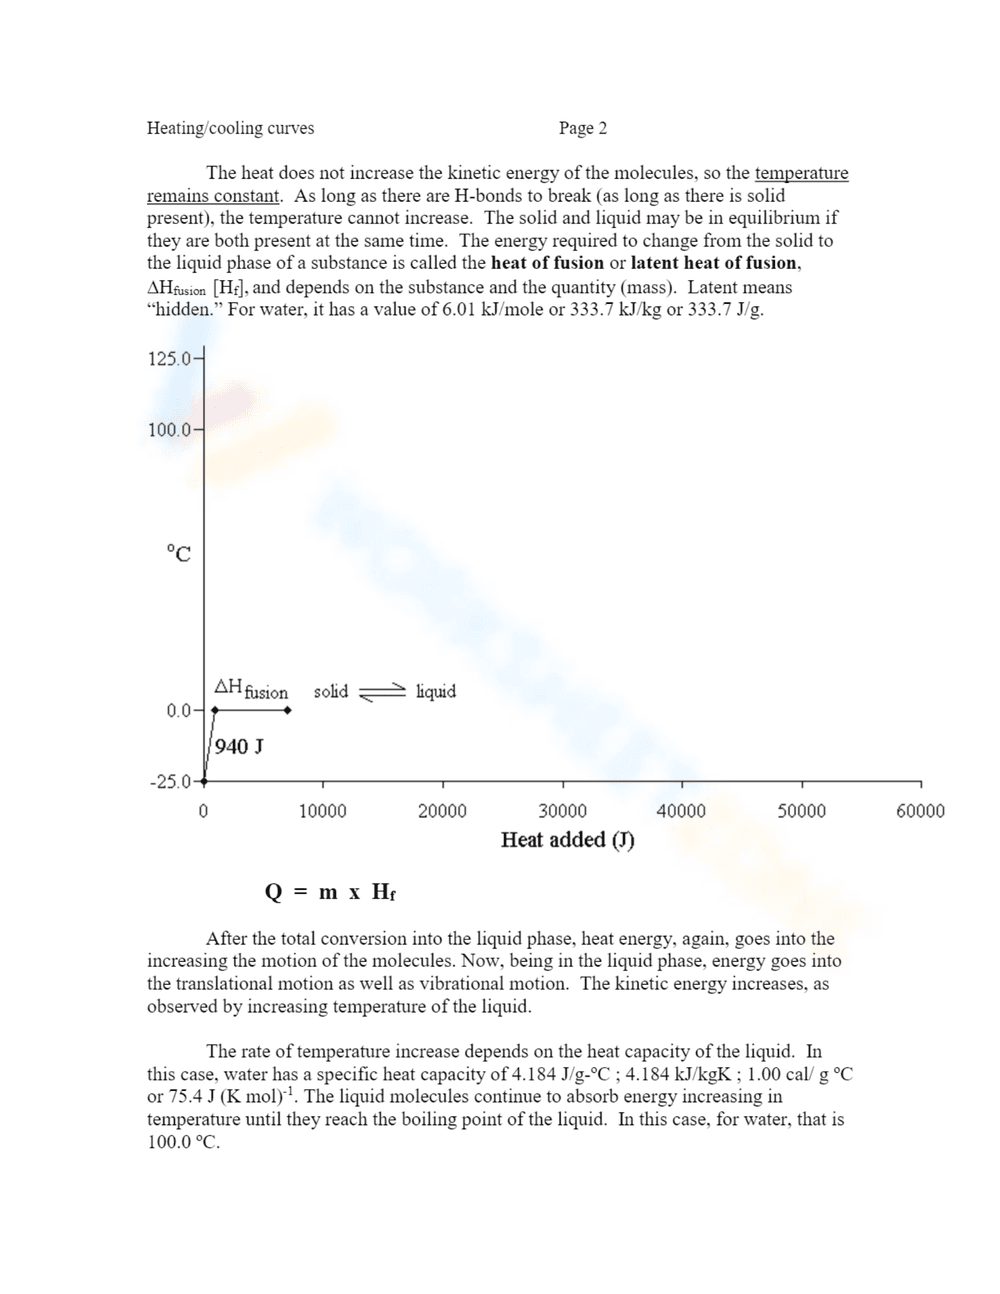
This is a science worksheet about energy and phase changes, specifically heating/cooling curves. It shows an example of heating curves for 18.0g of H2O from -25.0°C to 125.0°C. The worksheet includes text explaining how heat energy increases the kinetic energy of molecules in the solid phase, and how temperature relates to kinetic energy. It features a graph plotting temperature (°C) against heat added (J) and includes the formula Q = m x Cps x ΔT. The graph shows the initial heating of ice from -25°C to 0°C, with a calculation provided.
Grade Level Suitability:
This worksheet is suitable for grades 9-12 (high school) or introductory college level. The concepts of heat capacity, phase changes, kinetic energy, and the use of formulas to calculate heat transfer are typically covered in these grades. The graph analysis and calculations require a solid understanding of algebra and basic physics.
Why Use It:
This worksheet helps students understand the relationship between heat energy and temperature changes during phase transitions. It reinforces the concept of specific heat capacity and allows students to visualize heating curves. It provides a practical example of calculating heat transfer using the formula Q = m x Cps x ΔT. It also introduces the concept of overcoming intermolecular forces during phase changes.
How to Use It:
Use this worksheet as a guide for understanding heating curves. Review the text to grasp the concepts of heat capacity and kinetic energy. Analyze the graph to understand how temperature changes with the addition of heat. Use the provided formula and example calculation to solve similar problems. The worksheet can be used for individual study, classroom instruction, or as a homework assignment.
Target Users:
The target users are high school students studying chemistry or physics, as well as introductory college students in science courses. It's also suitable for teachers looking for examples and practice problems related to heat transfer and phase changes.