


1 / 2
0
Views
0
Downloads
0.0
0
Save
0 Likes
Graphing Systems of Linear Equations Worksheet
0 Views
0 Downloads
Paste this activity's link or code into your existing LMS (Google Classroom, Canvas, Teams, Schoology, Moodle, etc.).
Students can open and work on the activity right away, with no student login required.
You'll still be able to track student progress and results from your teacher account.
Information
Description
What It Is:
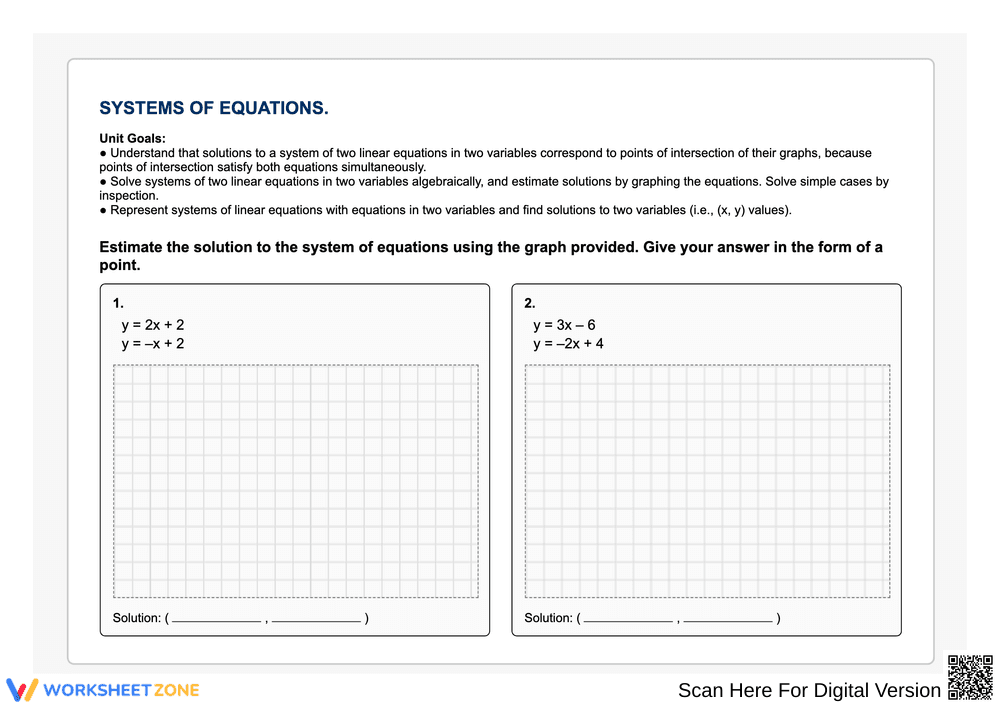
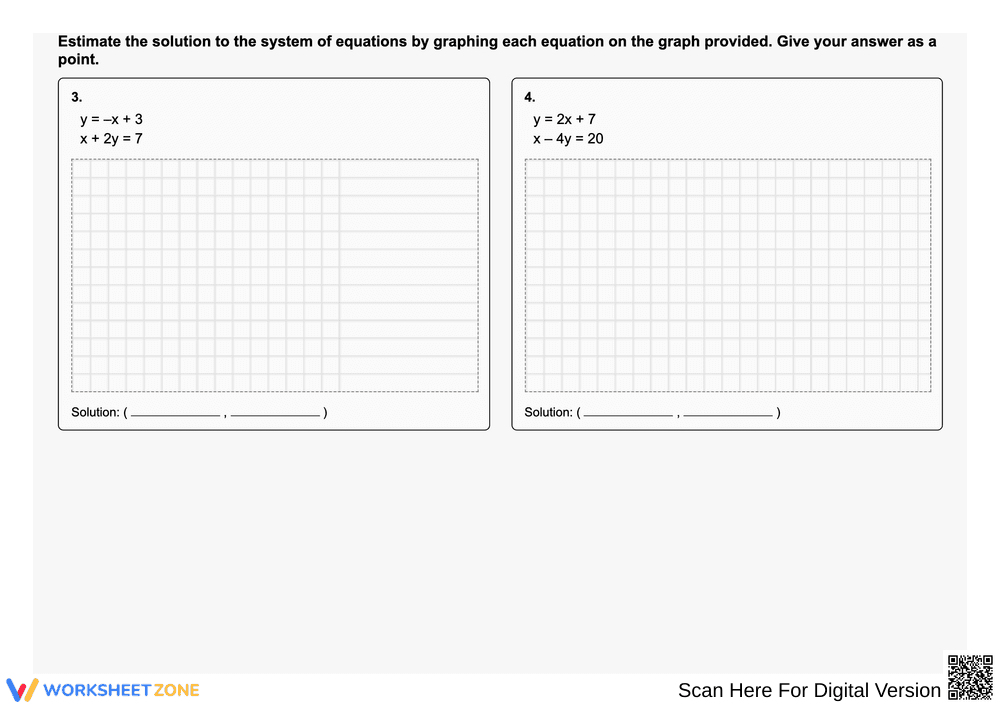
A graphing-based systems of equations worksheet where students estimate the solutions of linear systems by identifying the point of intersection on provided coordinate grids. The worksheet includes two systems of linear equations written in slope-intercept form, each paired with its own graph for visual estimation.
Why Use It:
This worksheet helps students build conceptual understanding of how solutions to systems correspond to intersection points. It develops graph-reading accuracy, reinforces slope and intercept concepts, and supports students in recognizing when a solution can be estimated visually rather than computed algebraically. It is ideal for introducing systems or reinforcing graphical methods.
How to Use It:
• Have students plot both lines on the provided grid using slope and intercept.
• Identify the point where the two lines intersect and estimate the ordered pair.
• Compare visual estimates with algebraic solutions to strengthen understanding.
• Use as guided practice, independent work, a warm-up, or an assessment task.
Grade Suitability:
Best suited for Grades 7–11.
• Perfect for Algebra 1 systems of equations units.
• Useful for Pre-Algebra introduction to graphing linear relationships.
Target Users:
Math teachers, tutors, intervention specialists, homeschool educators, and students learning to solve systems of linear equations by graphing.