


Views
Downloads

Essential Graphing Linear Equations Worksheet | Grade 8-HS
Paste this activity's link or code into your existing LMS (Google Classroom, Canvas, Teams, Schoology, Moodle, etc.).
Students can open and work on the activity right away, with no student login required.
You'll still be able to track student progress and results from your teacher account.
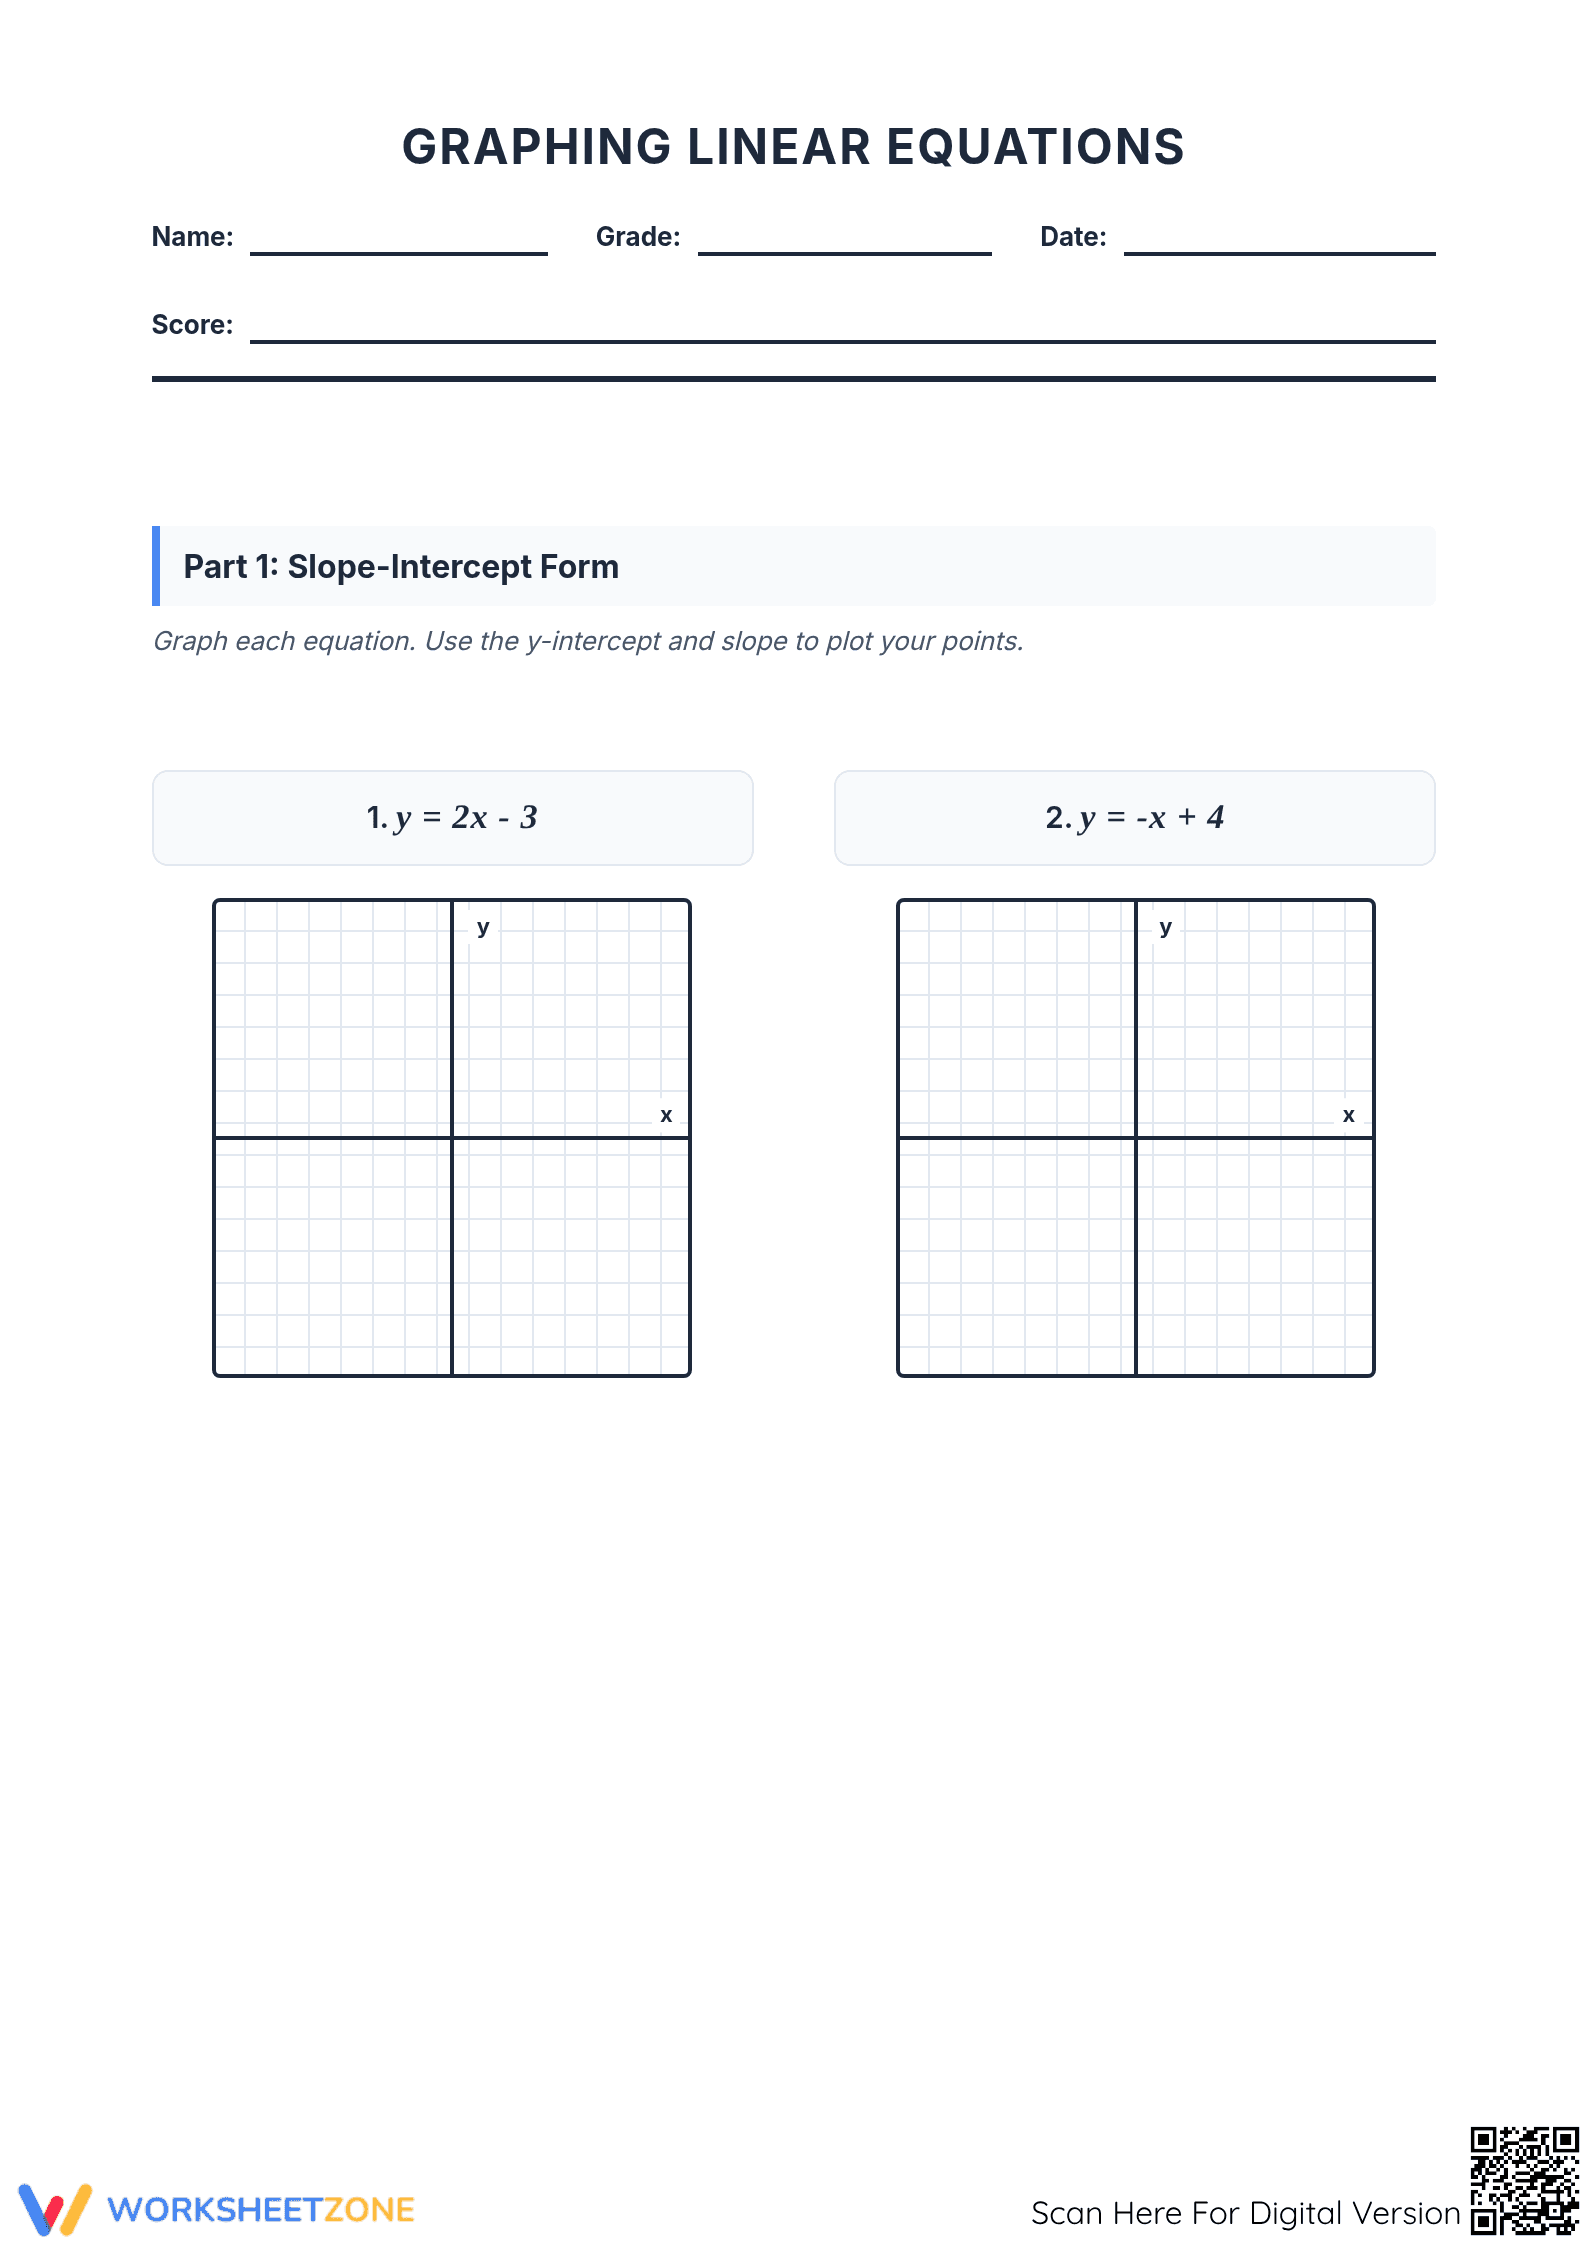
This graphing linear equations worksheet provides students with targeted practice in visualizing algebraic relationships. By working through slope-intercept and standard forms, learners develop a concrete understanding of how equations translate to coordinate planes. This resource builds fluency in plotting points and drawing lines, ensuring students achieve mastery in foundational algebra skills.
At a Glance
- Grade: 8-10 · Subject: Algebra
- Standard:
HSA-REI.D.10— Understand that the graph of an equation is the set of its solutions- Skill Focus: Graphing linear equations in multiple forms
- Format: 5 pages · 18 problems · Answer key included · PDF
- Best For: Independent practice and algebraic skill reinforcement
- Time: 30–45 minutes
What's Inside
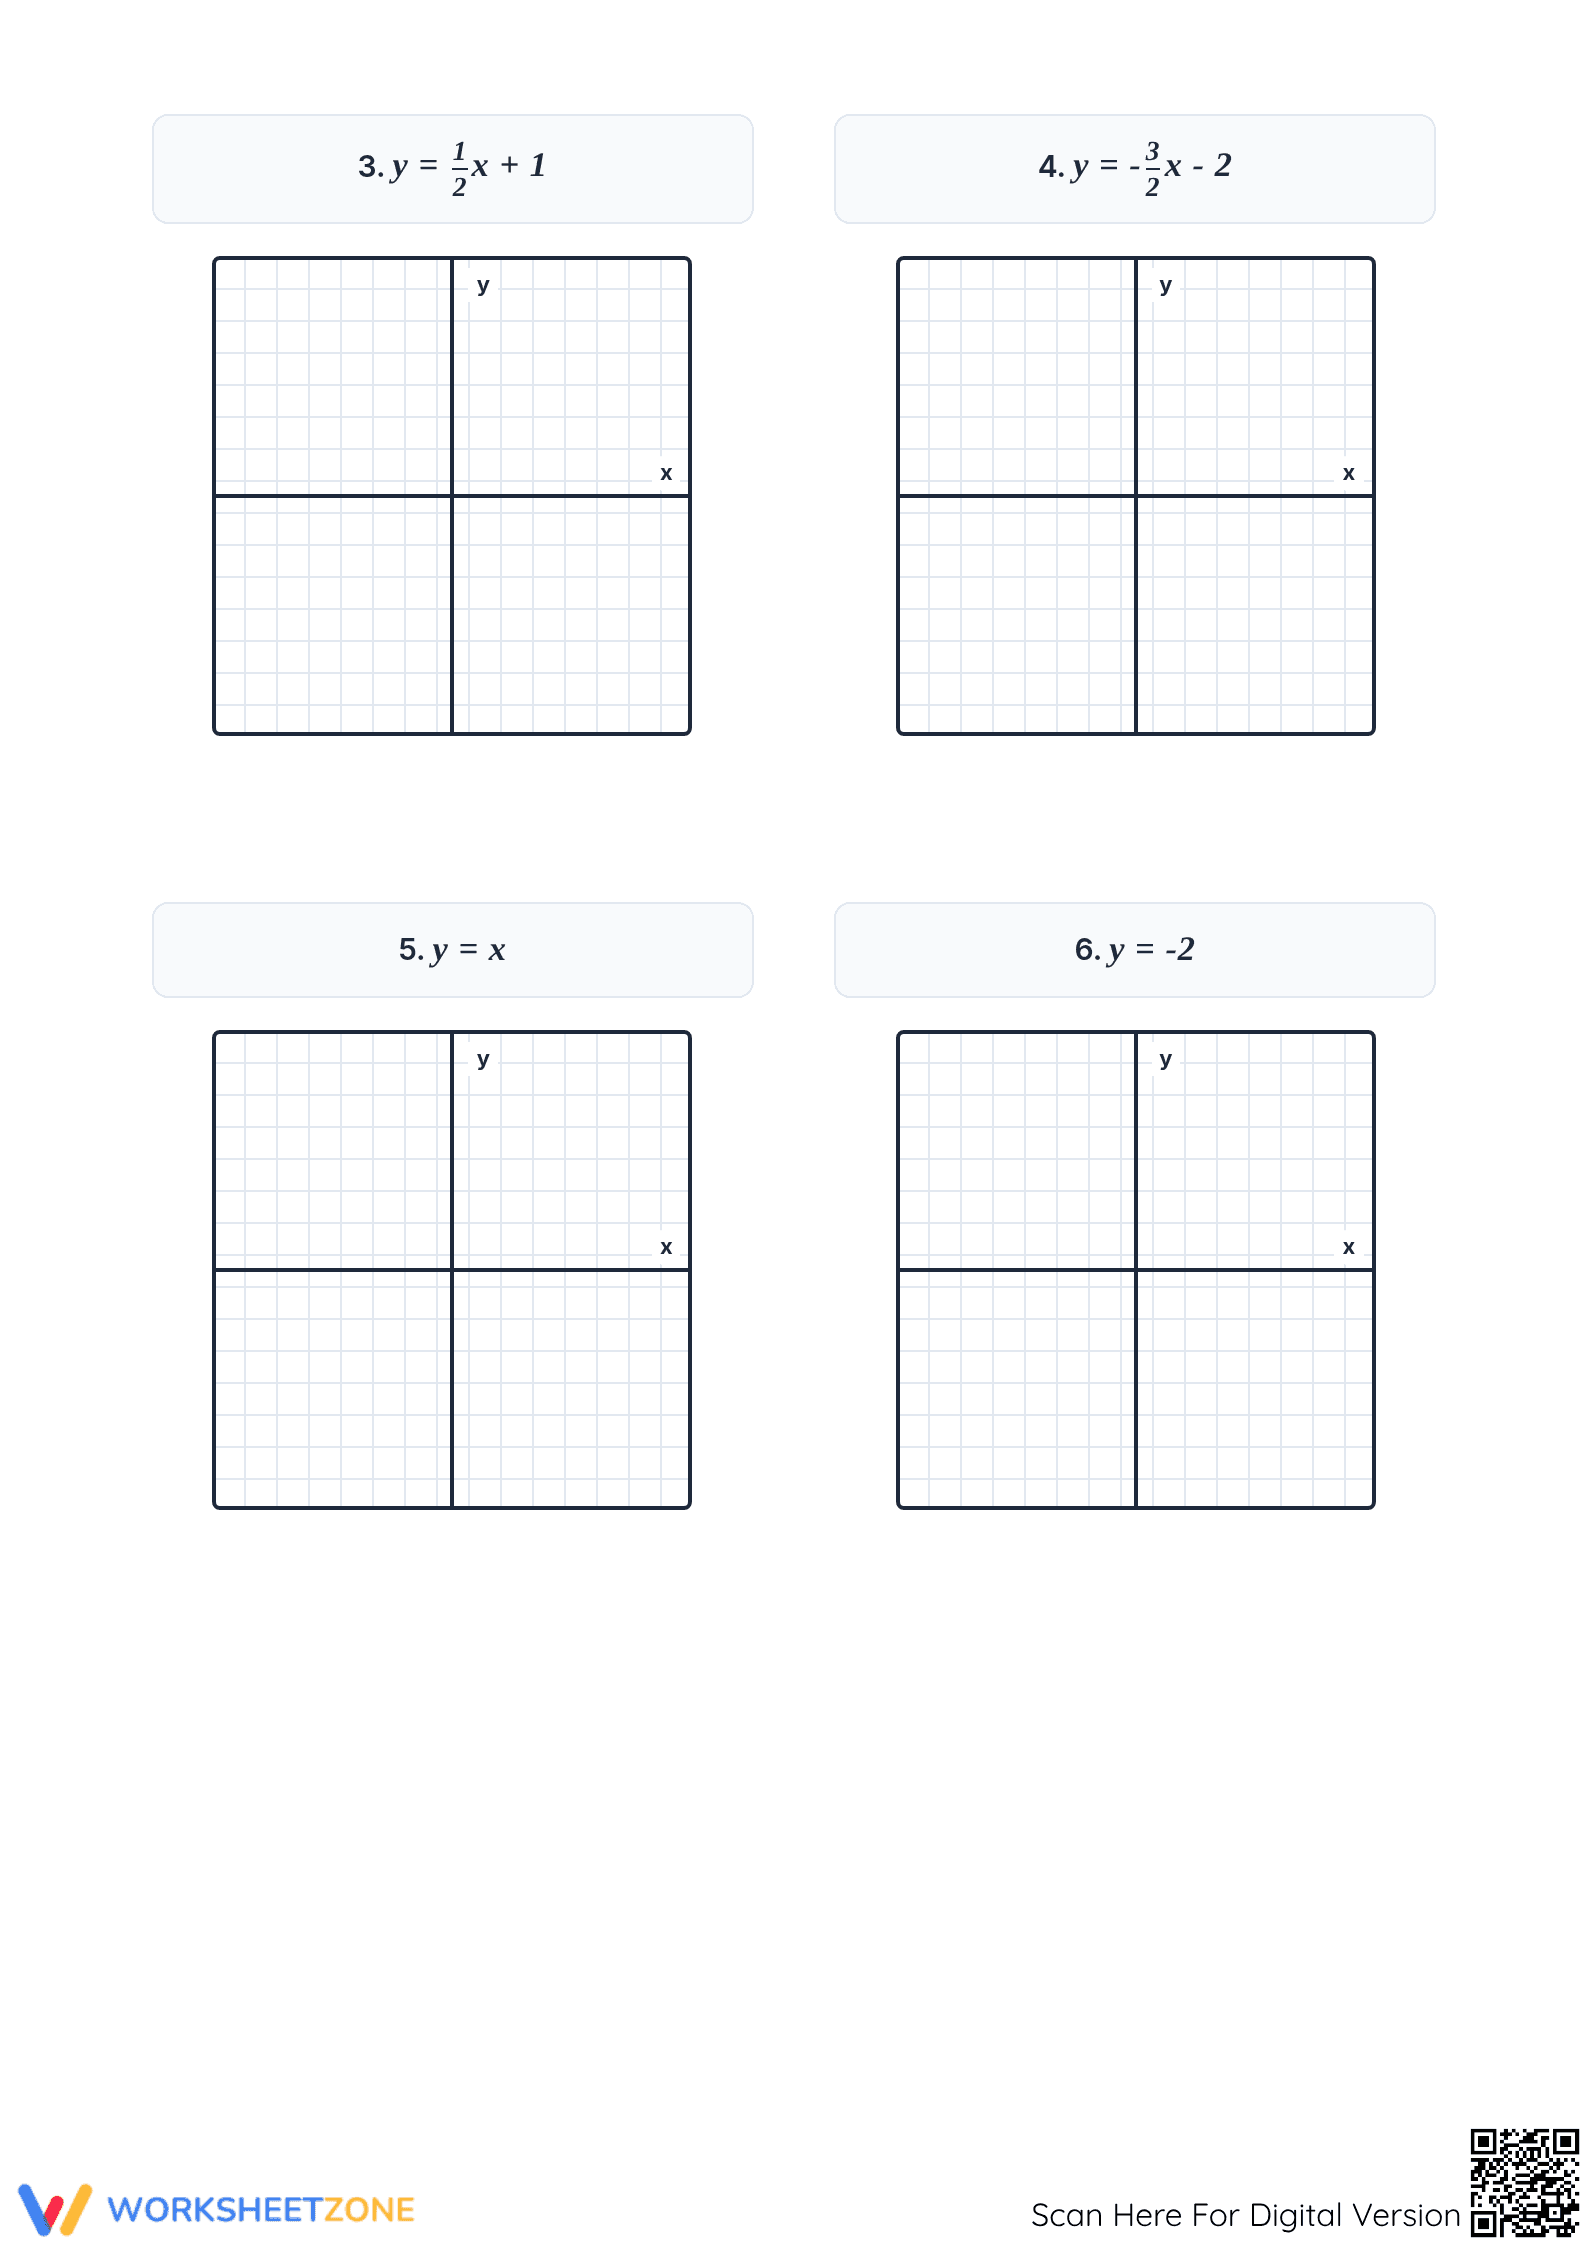
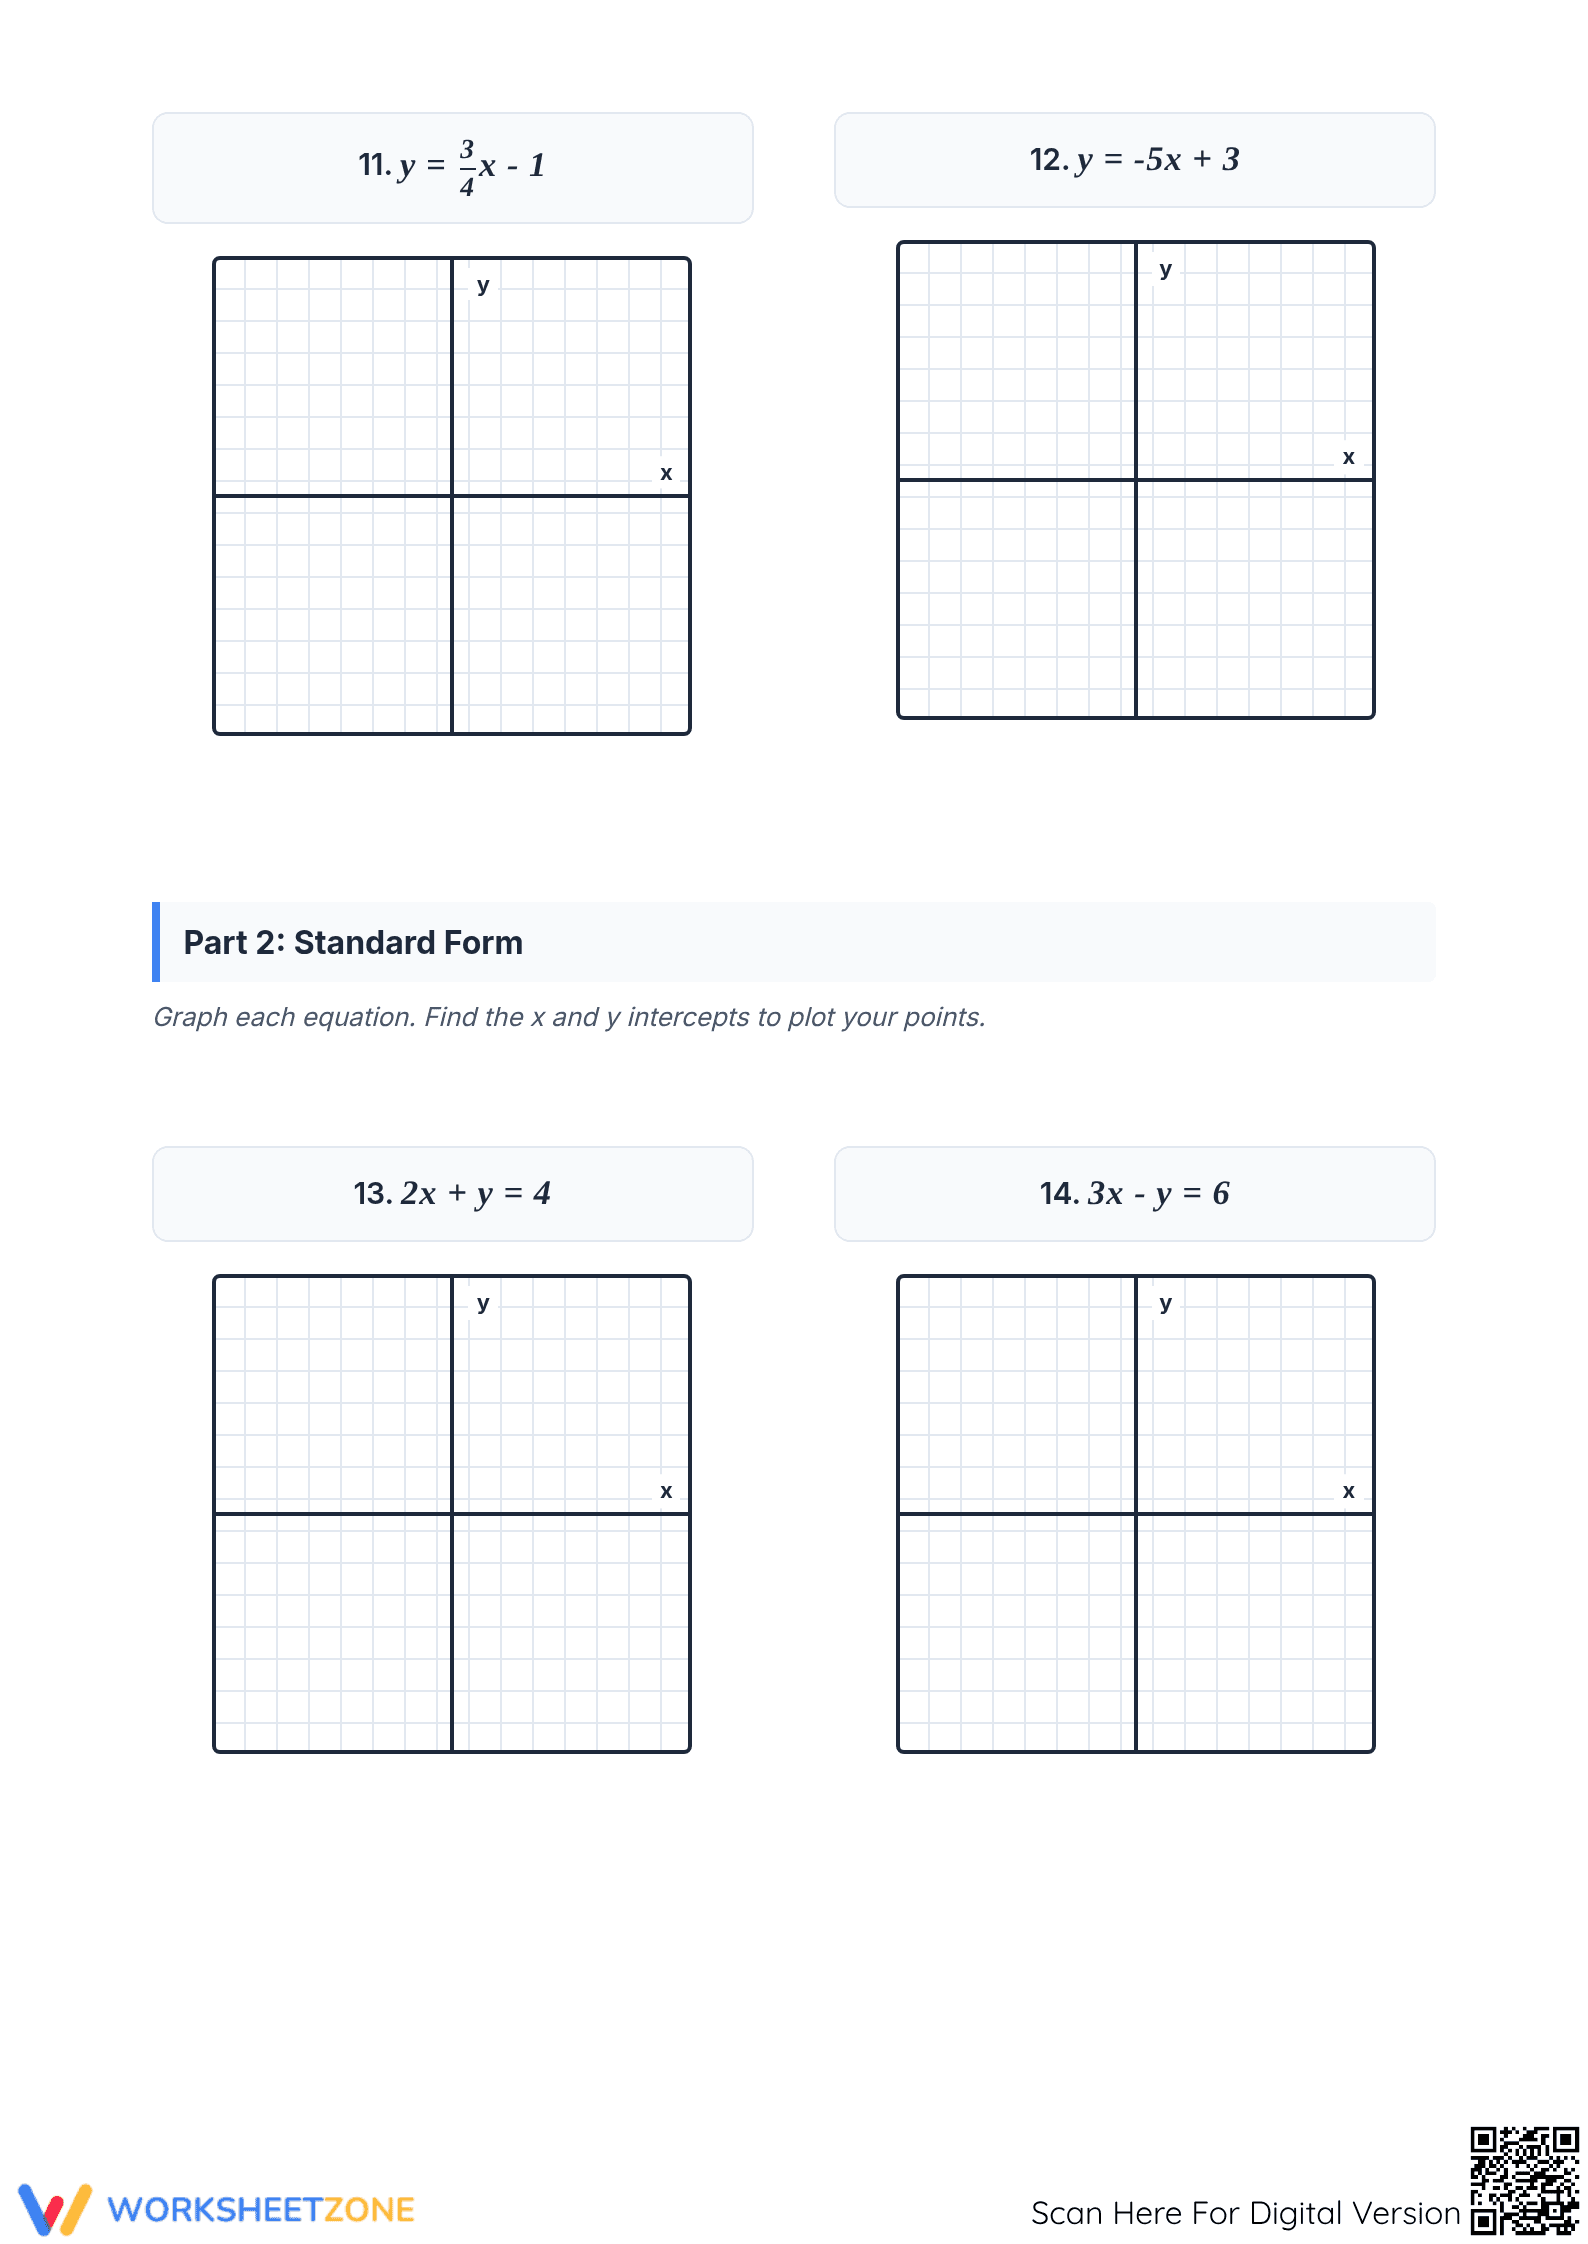
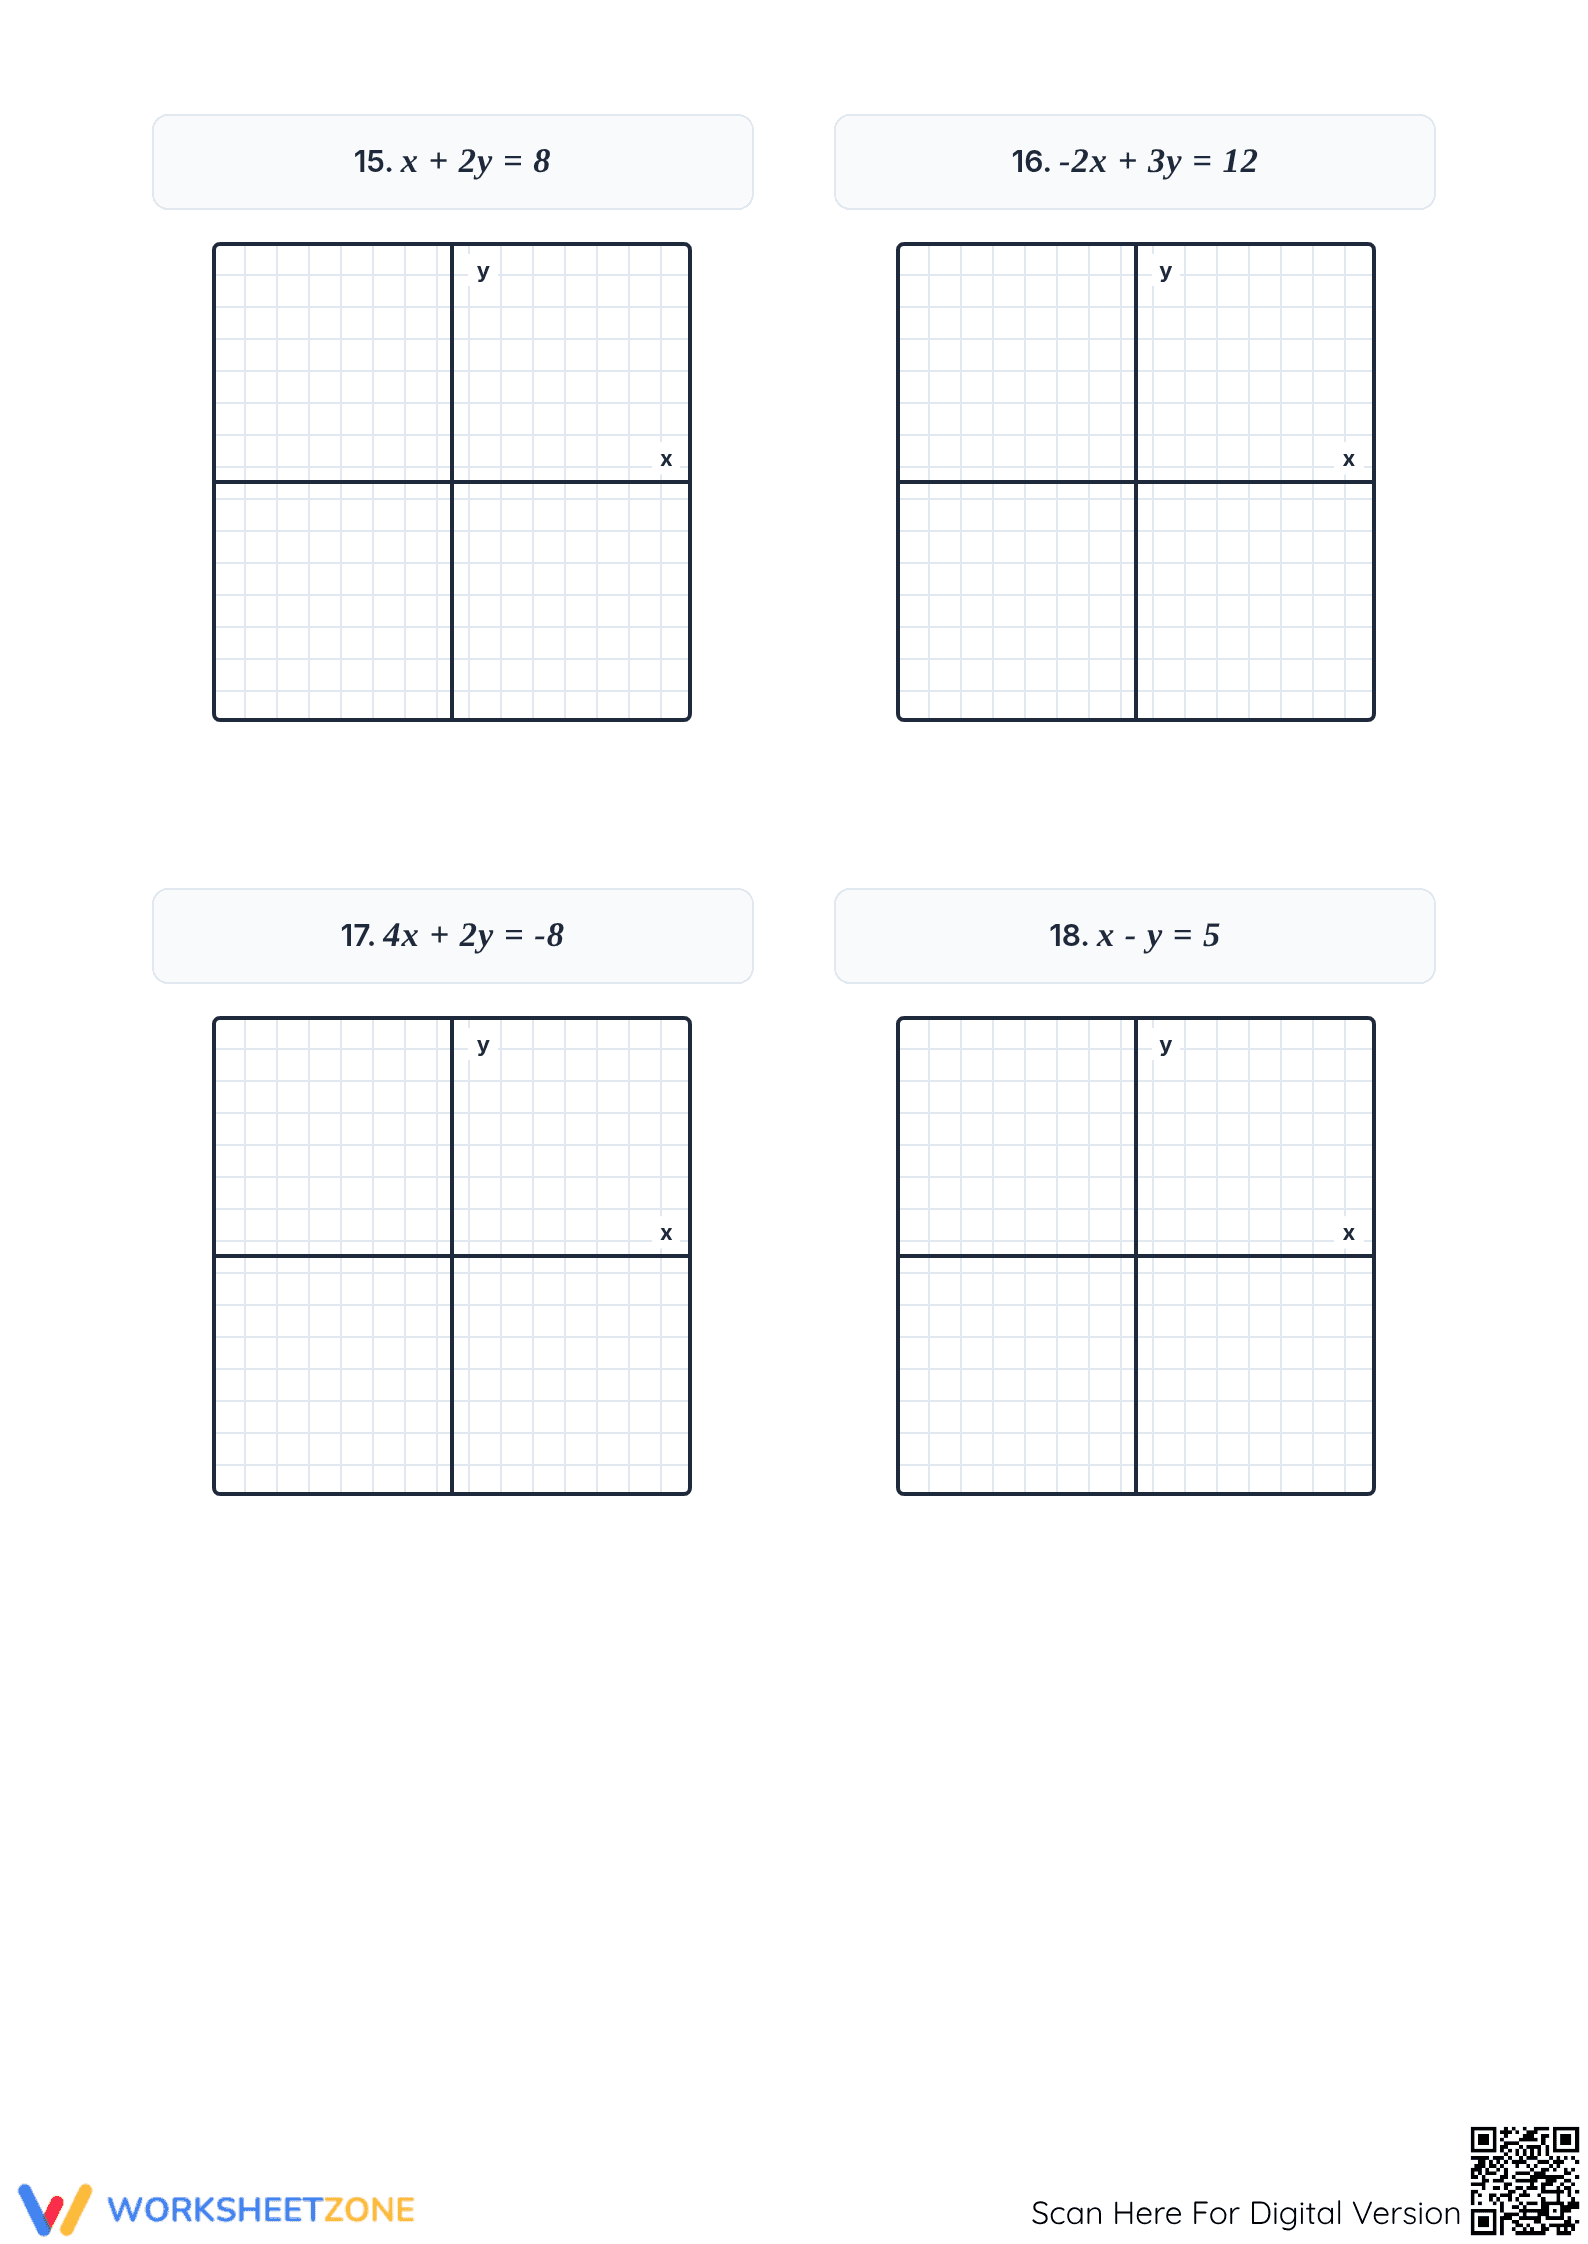
The worksheet is organized into two sections across five printable pages. Part 1 focuses on slope-intercept form, requiring students to apply the slope and y-intercept to plot twelve equations. Part 2 transitions to standard form, challenging students to find intercepts to graph six additional equations. A full answer key is provided for immediate feedback and grading.
Skill Progression
- Guided practice: The first page introduces slope-intercept equations with integer slopes, establishing the basic mechanics of plotting the y-intercept and following the rise-over-run method.
- Supported practice: Middle pages introduce fractional slopes and negative coefficients, requiring precise coordinate plotting and a deeper understanding of directional shifts on the grid.
- Independent practice: The final section moves to standard form, where students must calculate intercepts before graphing, representing the highest level of conceptual application.
This gradual-release model follows the I Do, We Do, You Do instructional framework to ensure student confidence throughout the set.
Standards Alignment
Aligned with HSA-REI.D.10, students learn that the graph of an equation in two variables is the set of all its solutions. It also supports 8.EE.B.5 by connecting proportional relationships to linear graphs. Both standard codes can be copied directly into lesson plans, IEP goals, or district curriculum mapping tools for easy documentation.
How to Use It
Use this worksheet during the practice phase of a linear functions lesson to assess individual student understanding. It serves as an excellent formative assessment tool; teachers should check if students correctly identify the y-intercept before applying the slope. Expect completion within a 45-minute class period or as a focused homework assignment.
Who It's For
Ideal for 8th-grade or high school Algebra 1 learners solidifying their graphing skills. The clear grid layout makes it accessible for students with diverse needs, including those requiring visual scaffolds. It pairs perfectly with a coordinate plane anchor chart or a direct instruction lesson on linear transformations.
Research conducted by Fisher & Frey (2014) emphasizes the critical role of structured practice in the gradual release of responsibility, particularly within abstract mathematical domains like algebra. This worksheet facilitates that transition by isolating the mechanical steps of graphing linear equations, allowing students to move from rote calculation to visual interpretation. By requiring students to interact with both slope-intercept and standard forms, the resource aligns with the RAND AIRS 2024 findings that multi-representation exposure improves long-term retention of algebraic concepts. The 18-task sequence provides the necessary repetition to move skills from short-term working memory into procedural fluency, a prerequisite for success in higher-level functions and calculus. Educators can confidently utilize this tool knowing it adheres to evidence-based instructional design principles that promote rigorous standards-based mastery in the secondary mathematics classroom.