


Views
Downloads
Printable Graphing Linear Equations Worksheet | Grade 9 Math
Paste this activity's link or code into your existing LMS (Google Classroom, Canvas, Teams, Schoology, Moodle, etc.).
Students can open and work on the activity right away, with no student login required.
You'll still be able to track student progress and results from your teacher account.
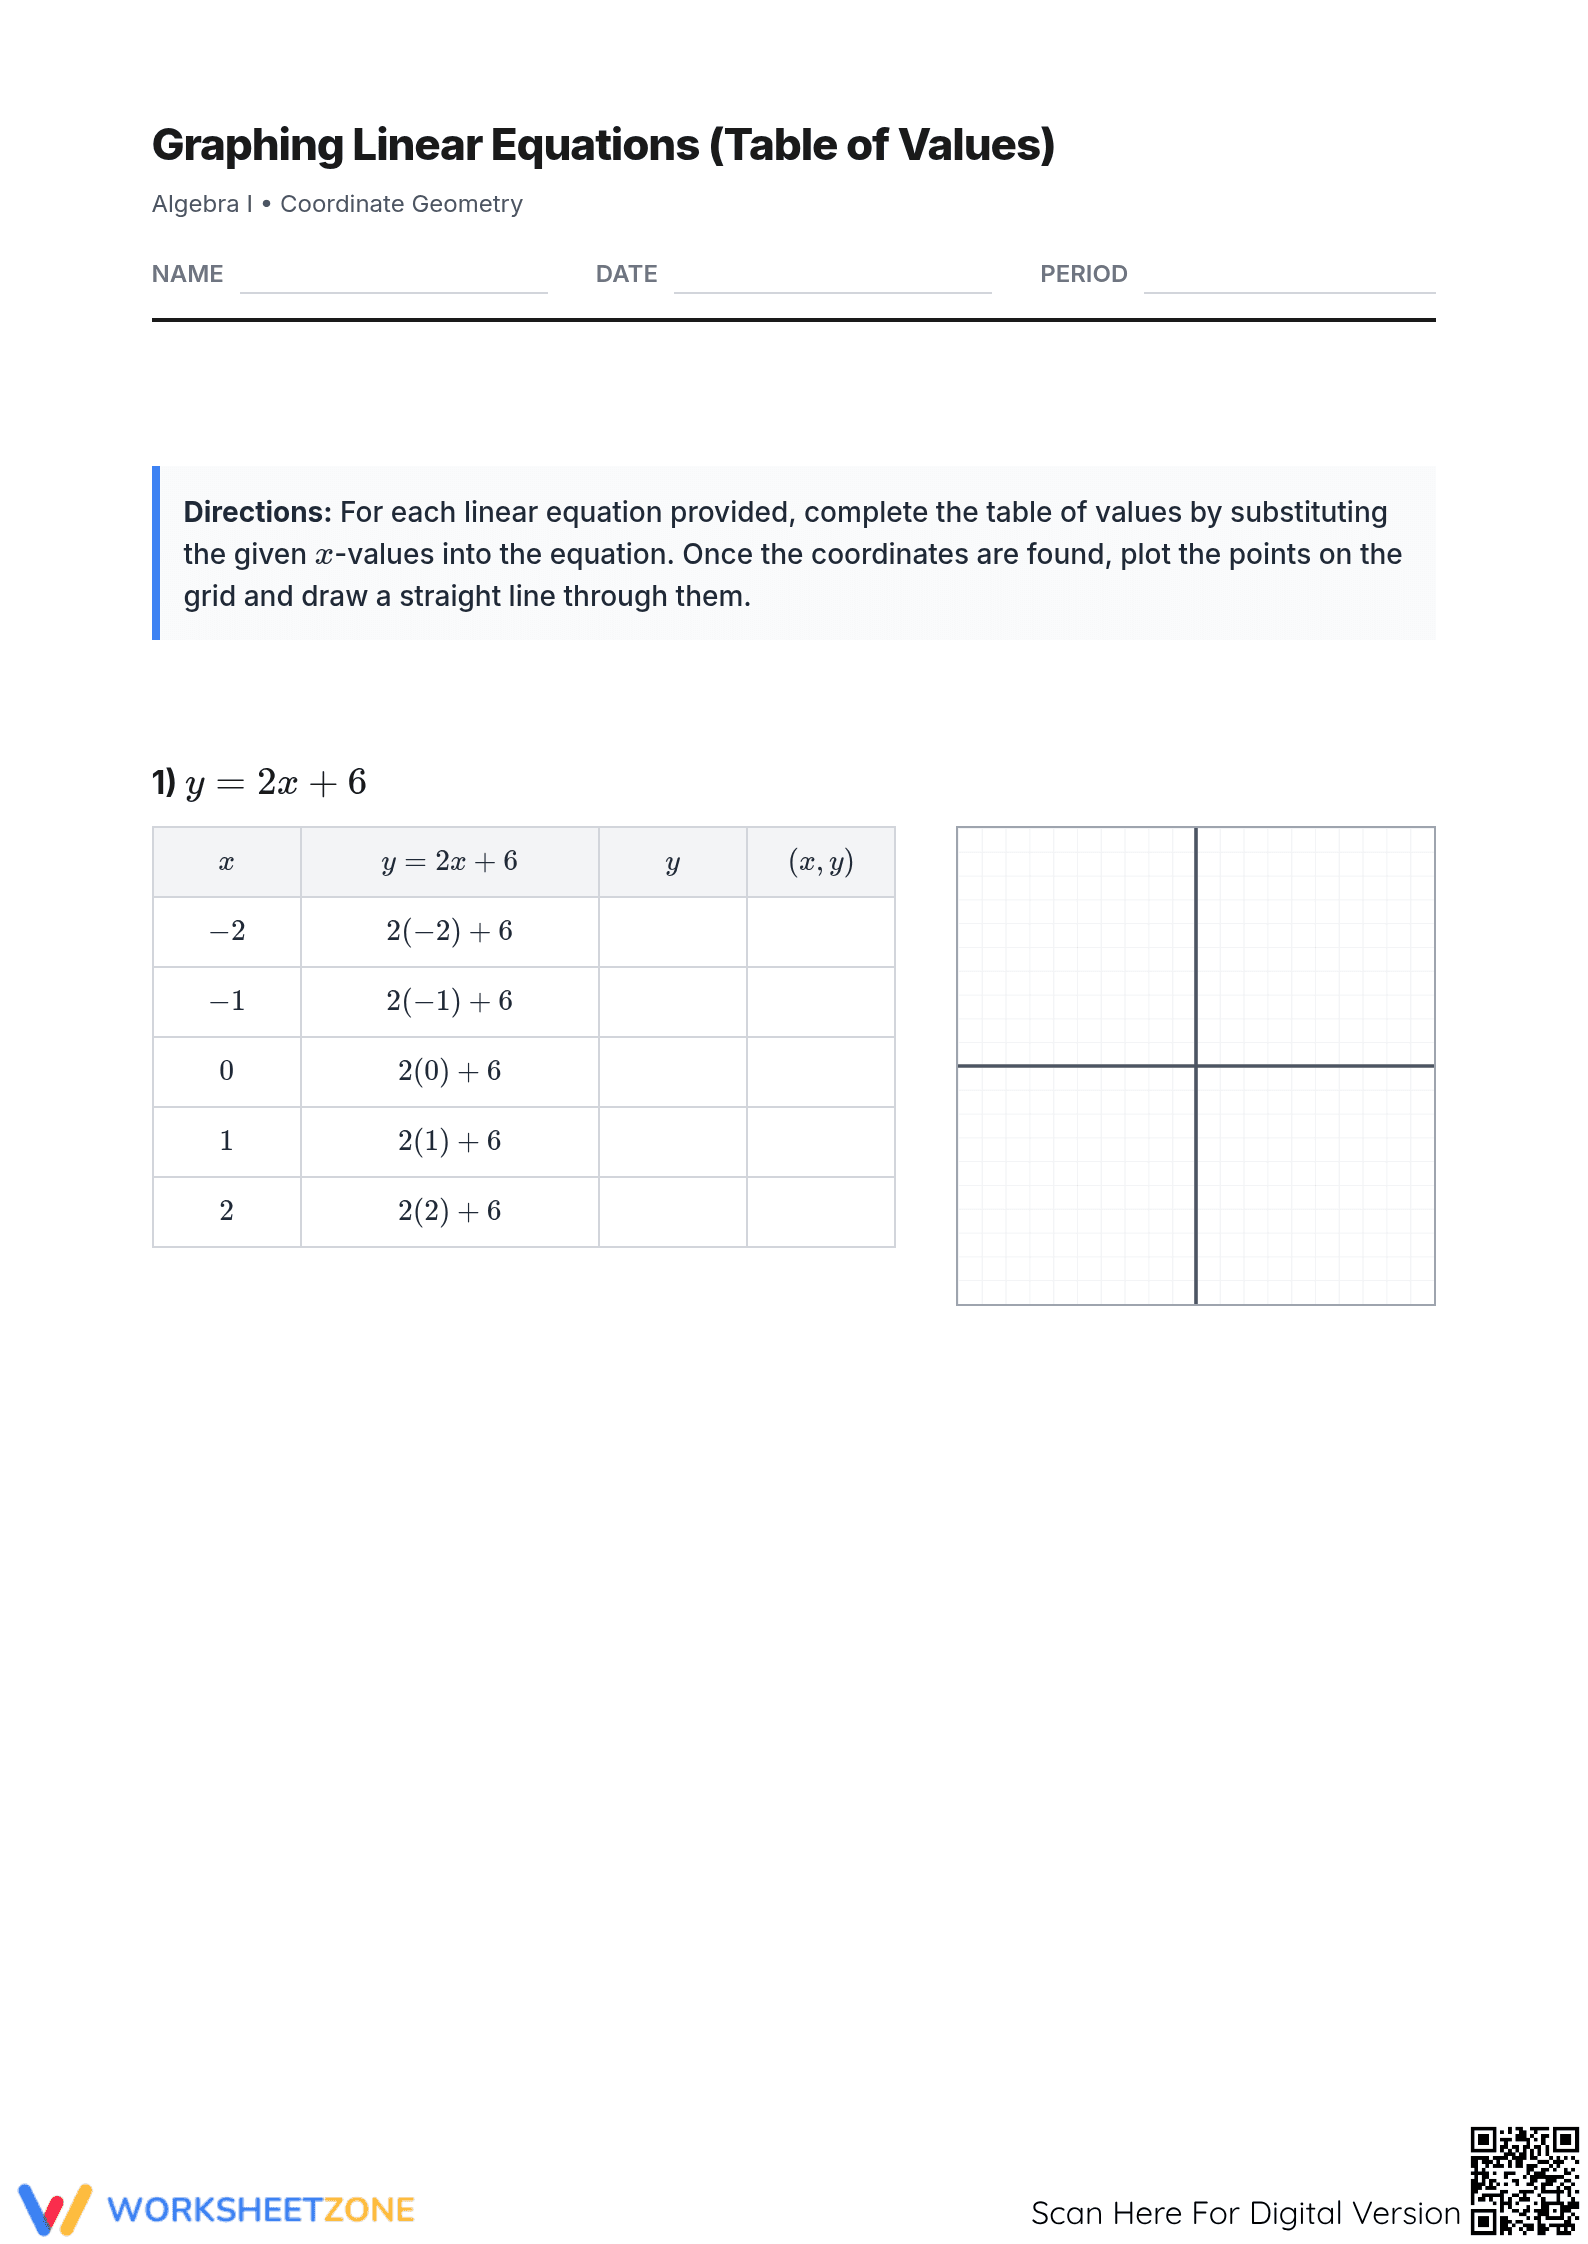
This comprehensive linear equations worksheet guides students through the essential process of graphing lines using a coordinate-based table of values. By calculating specific outputs for given inputs, learners build a conceptual bridge between algebraic functions and their visual representations on a Cartesian plane, ensuring they understand how every point satisfies the underlying linear equation.
At a Glance
- Grade: 9 · Subject: Algebra
- Standard:
HSA.REI.D.10— Understand that the graph of an equation is the set of its solutions- Skill Focus: Graphing Linear Equations
- Format: 4 pages · 6 problems · Answer key included · PDF
- Best For: Independent Practice and Homework
- Time: 30–45 minutes
What's Inside
The resource consists of a 4-page PDF featuring 6 unique linear graphing tasks. Each task includes a structured table where students substitute five distinct x-values into the provided equation to determine the corresponding y-values and ordered pairs. Adjacent to each table is a clean, pre-scaled coordinate grid where students plot their found points and draw a straight line. A complete answer key is provided for immediate feedback.
Skill Progression
- Guided Practice: The initial problem provides partially filled-out calculations to scaffold the substitution process for new learners.
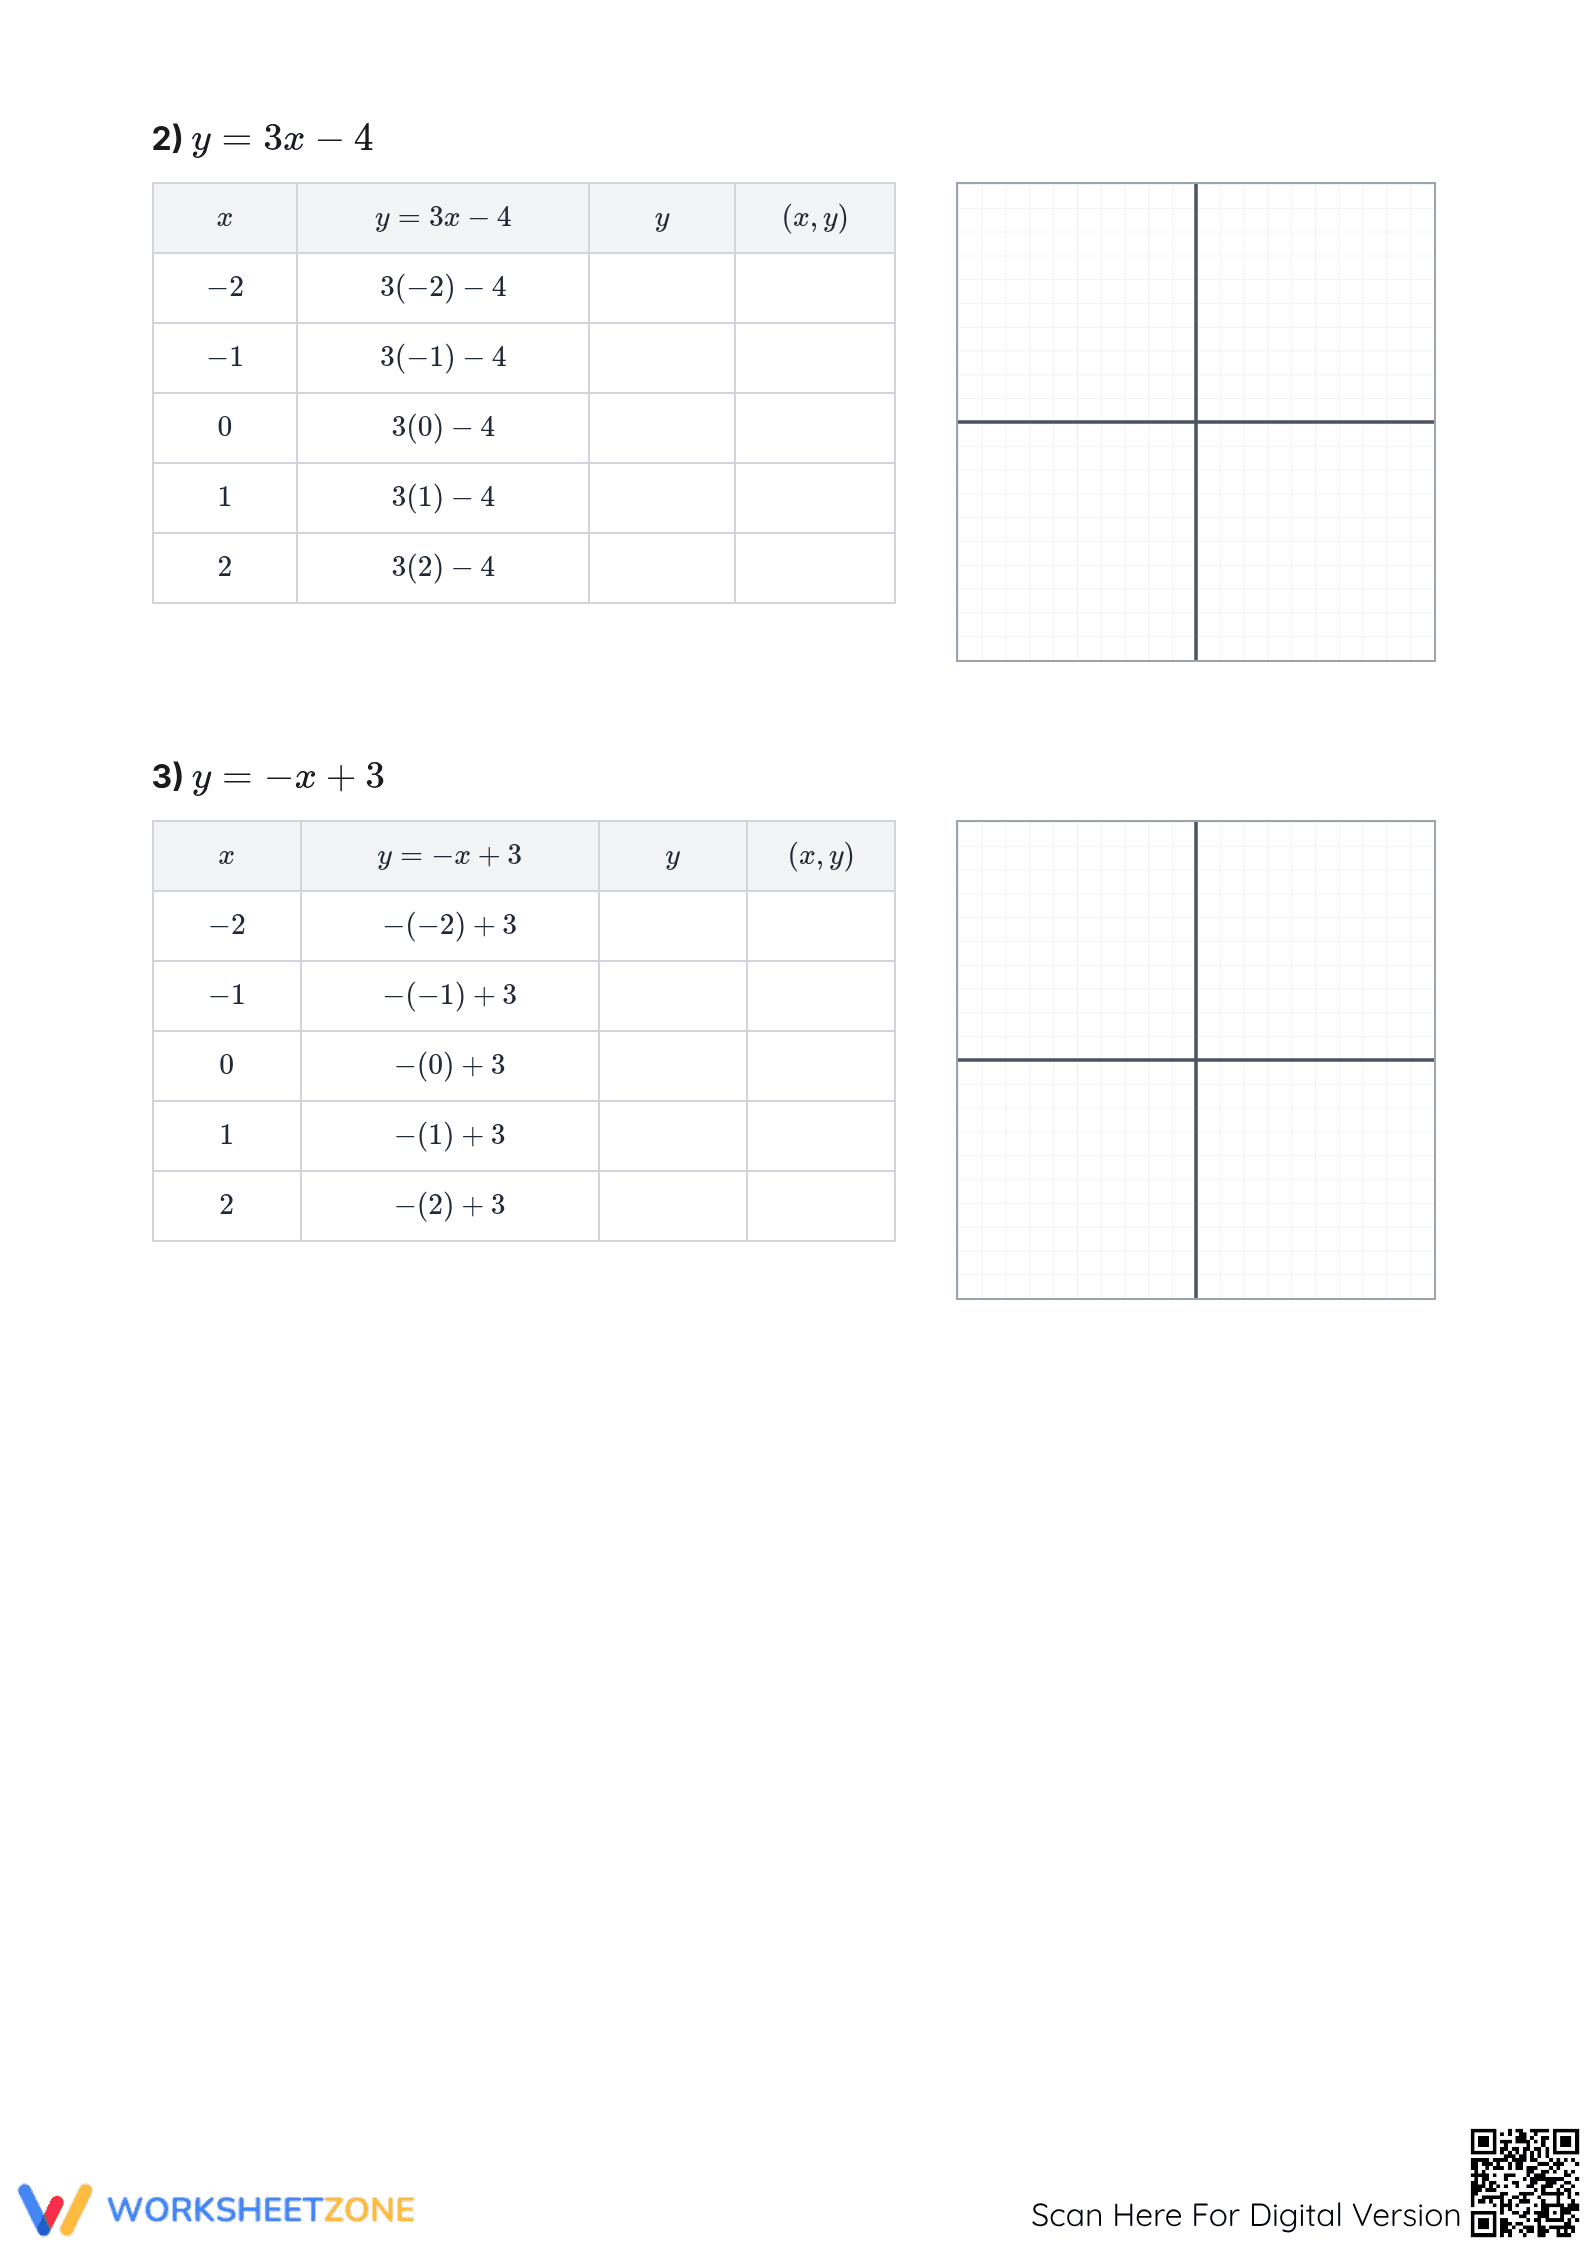
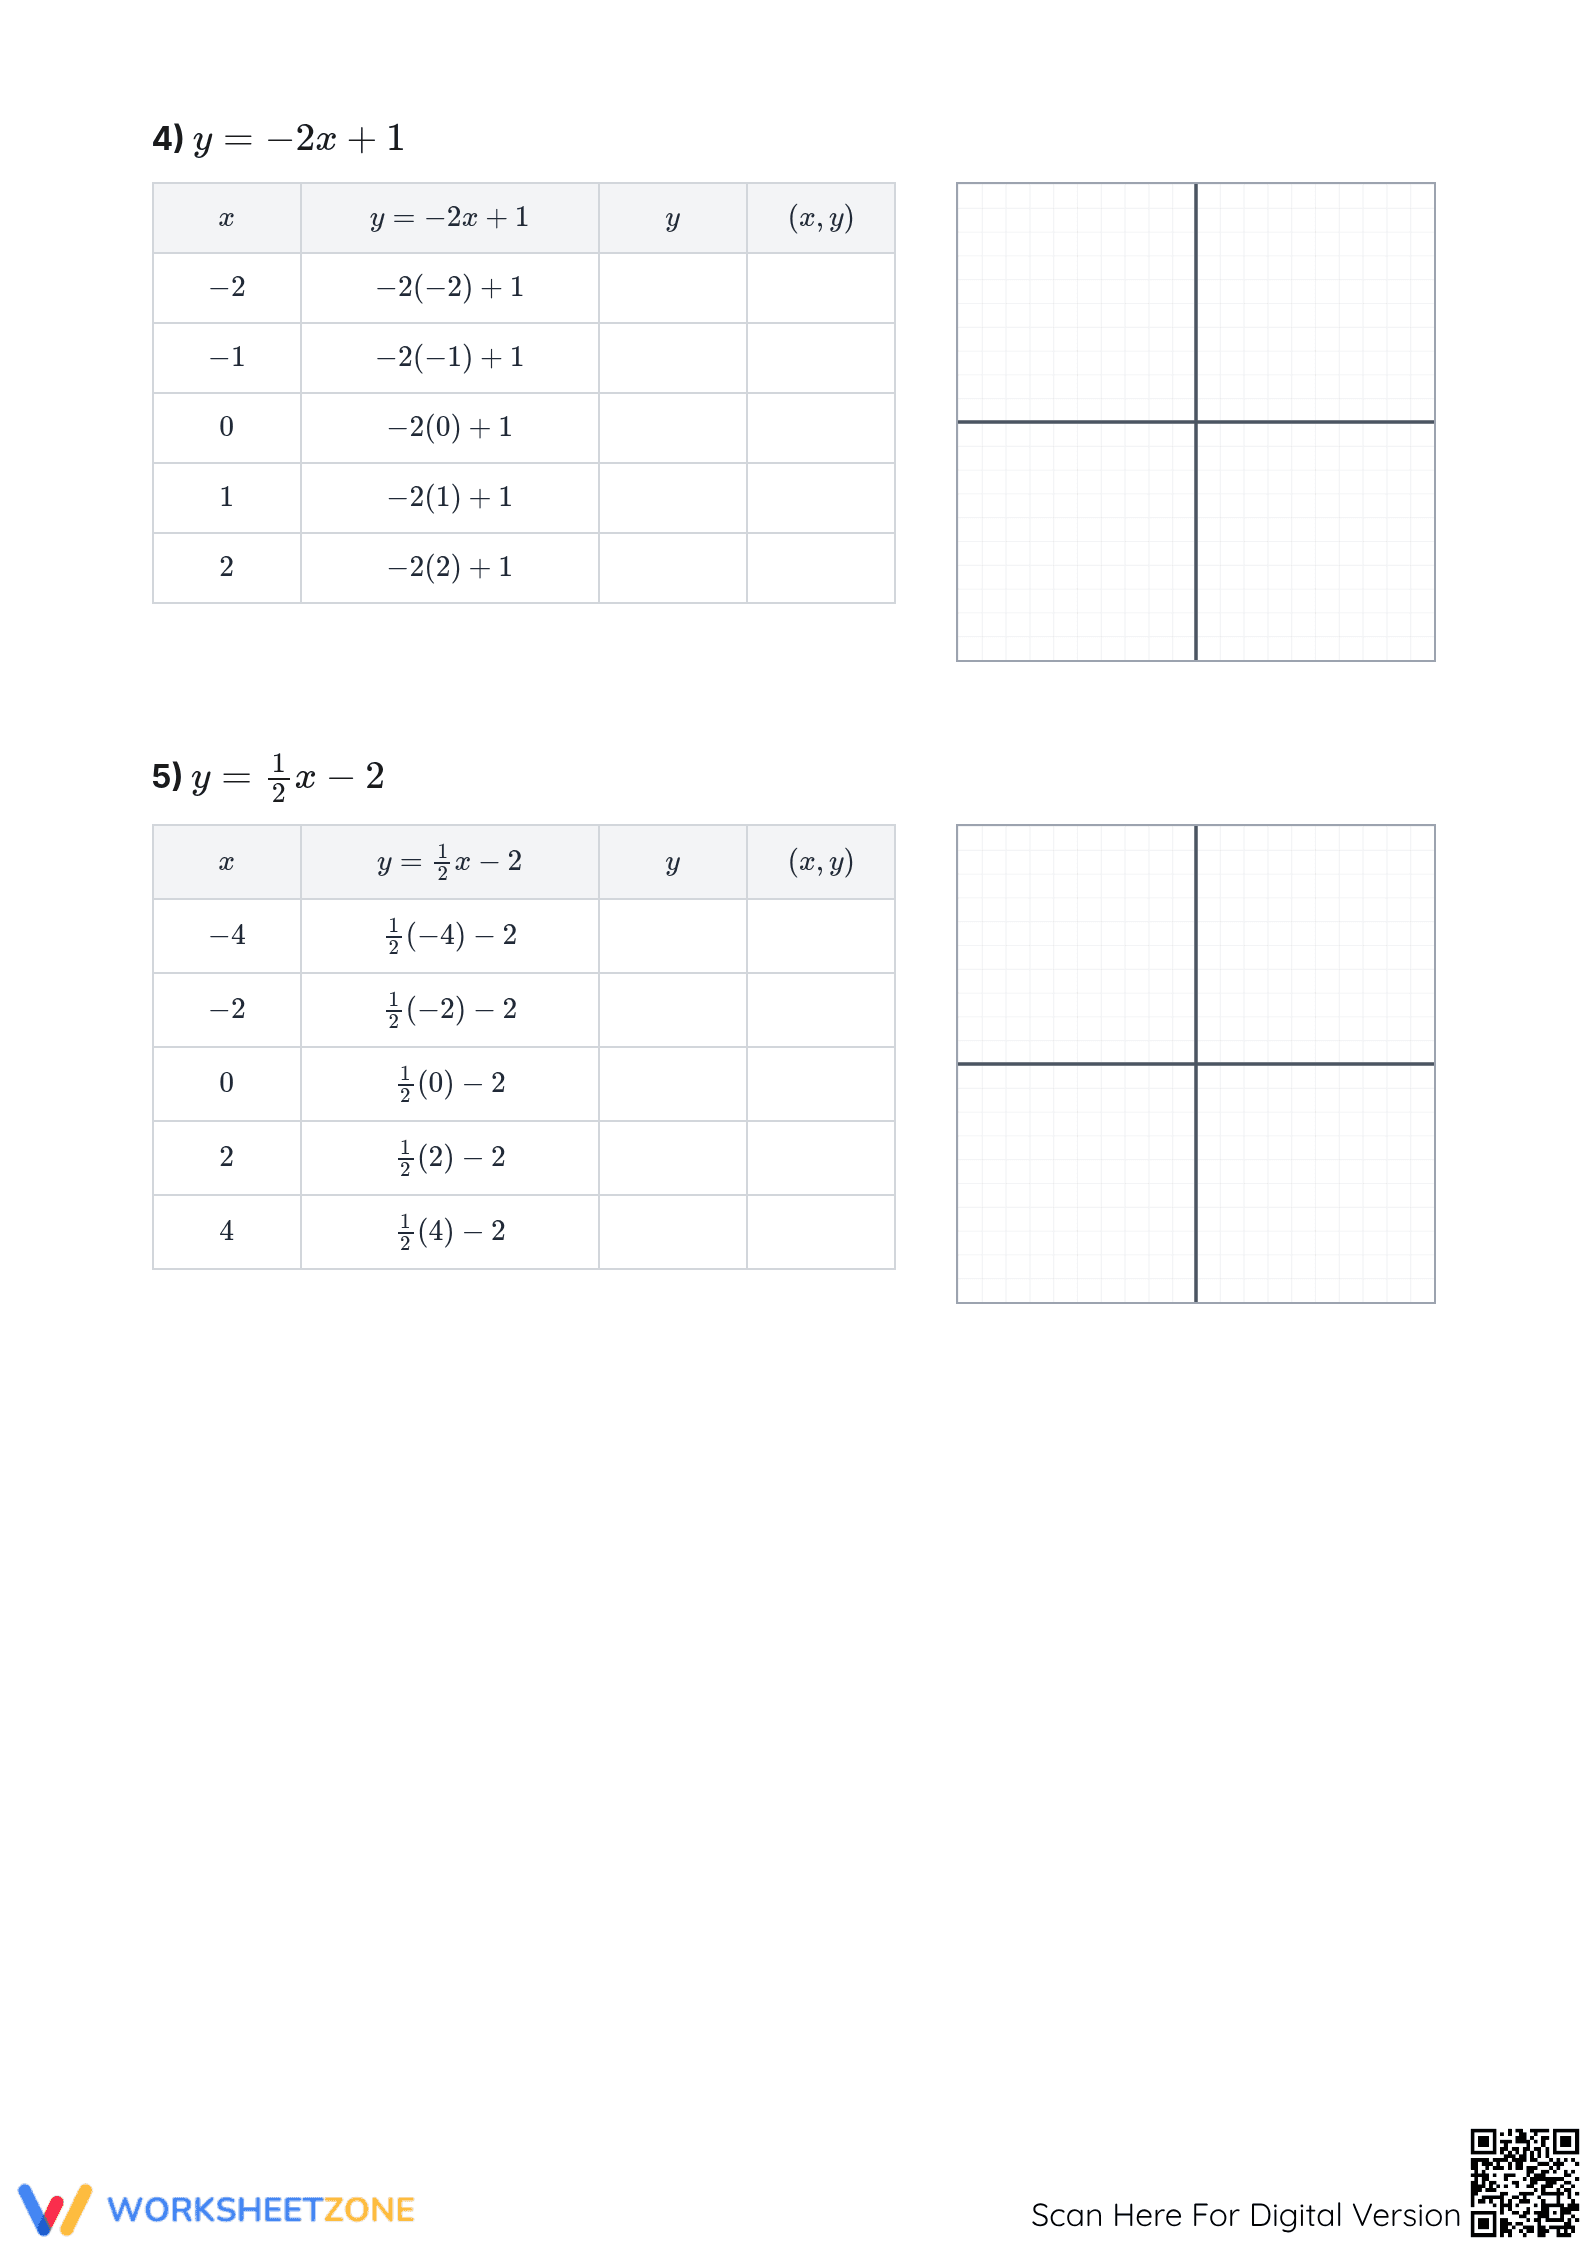
- Supported Practice: Middle problems (2–4) offer full tables and grids, requiring students to perform all calculations and plotting independently with consistent integer slopes.
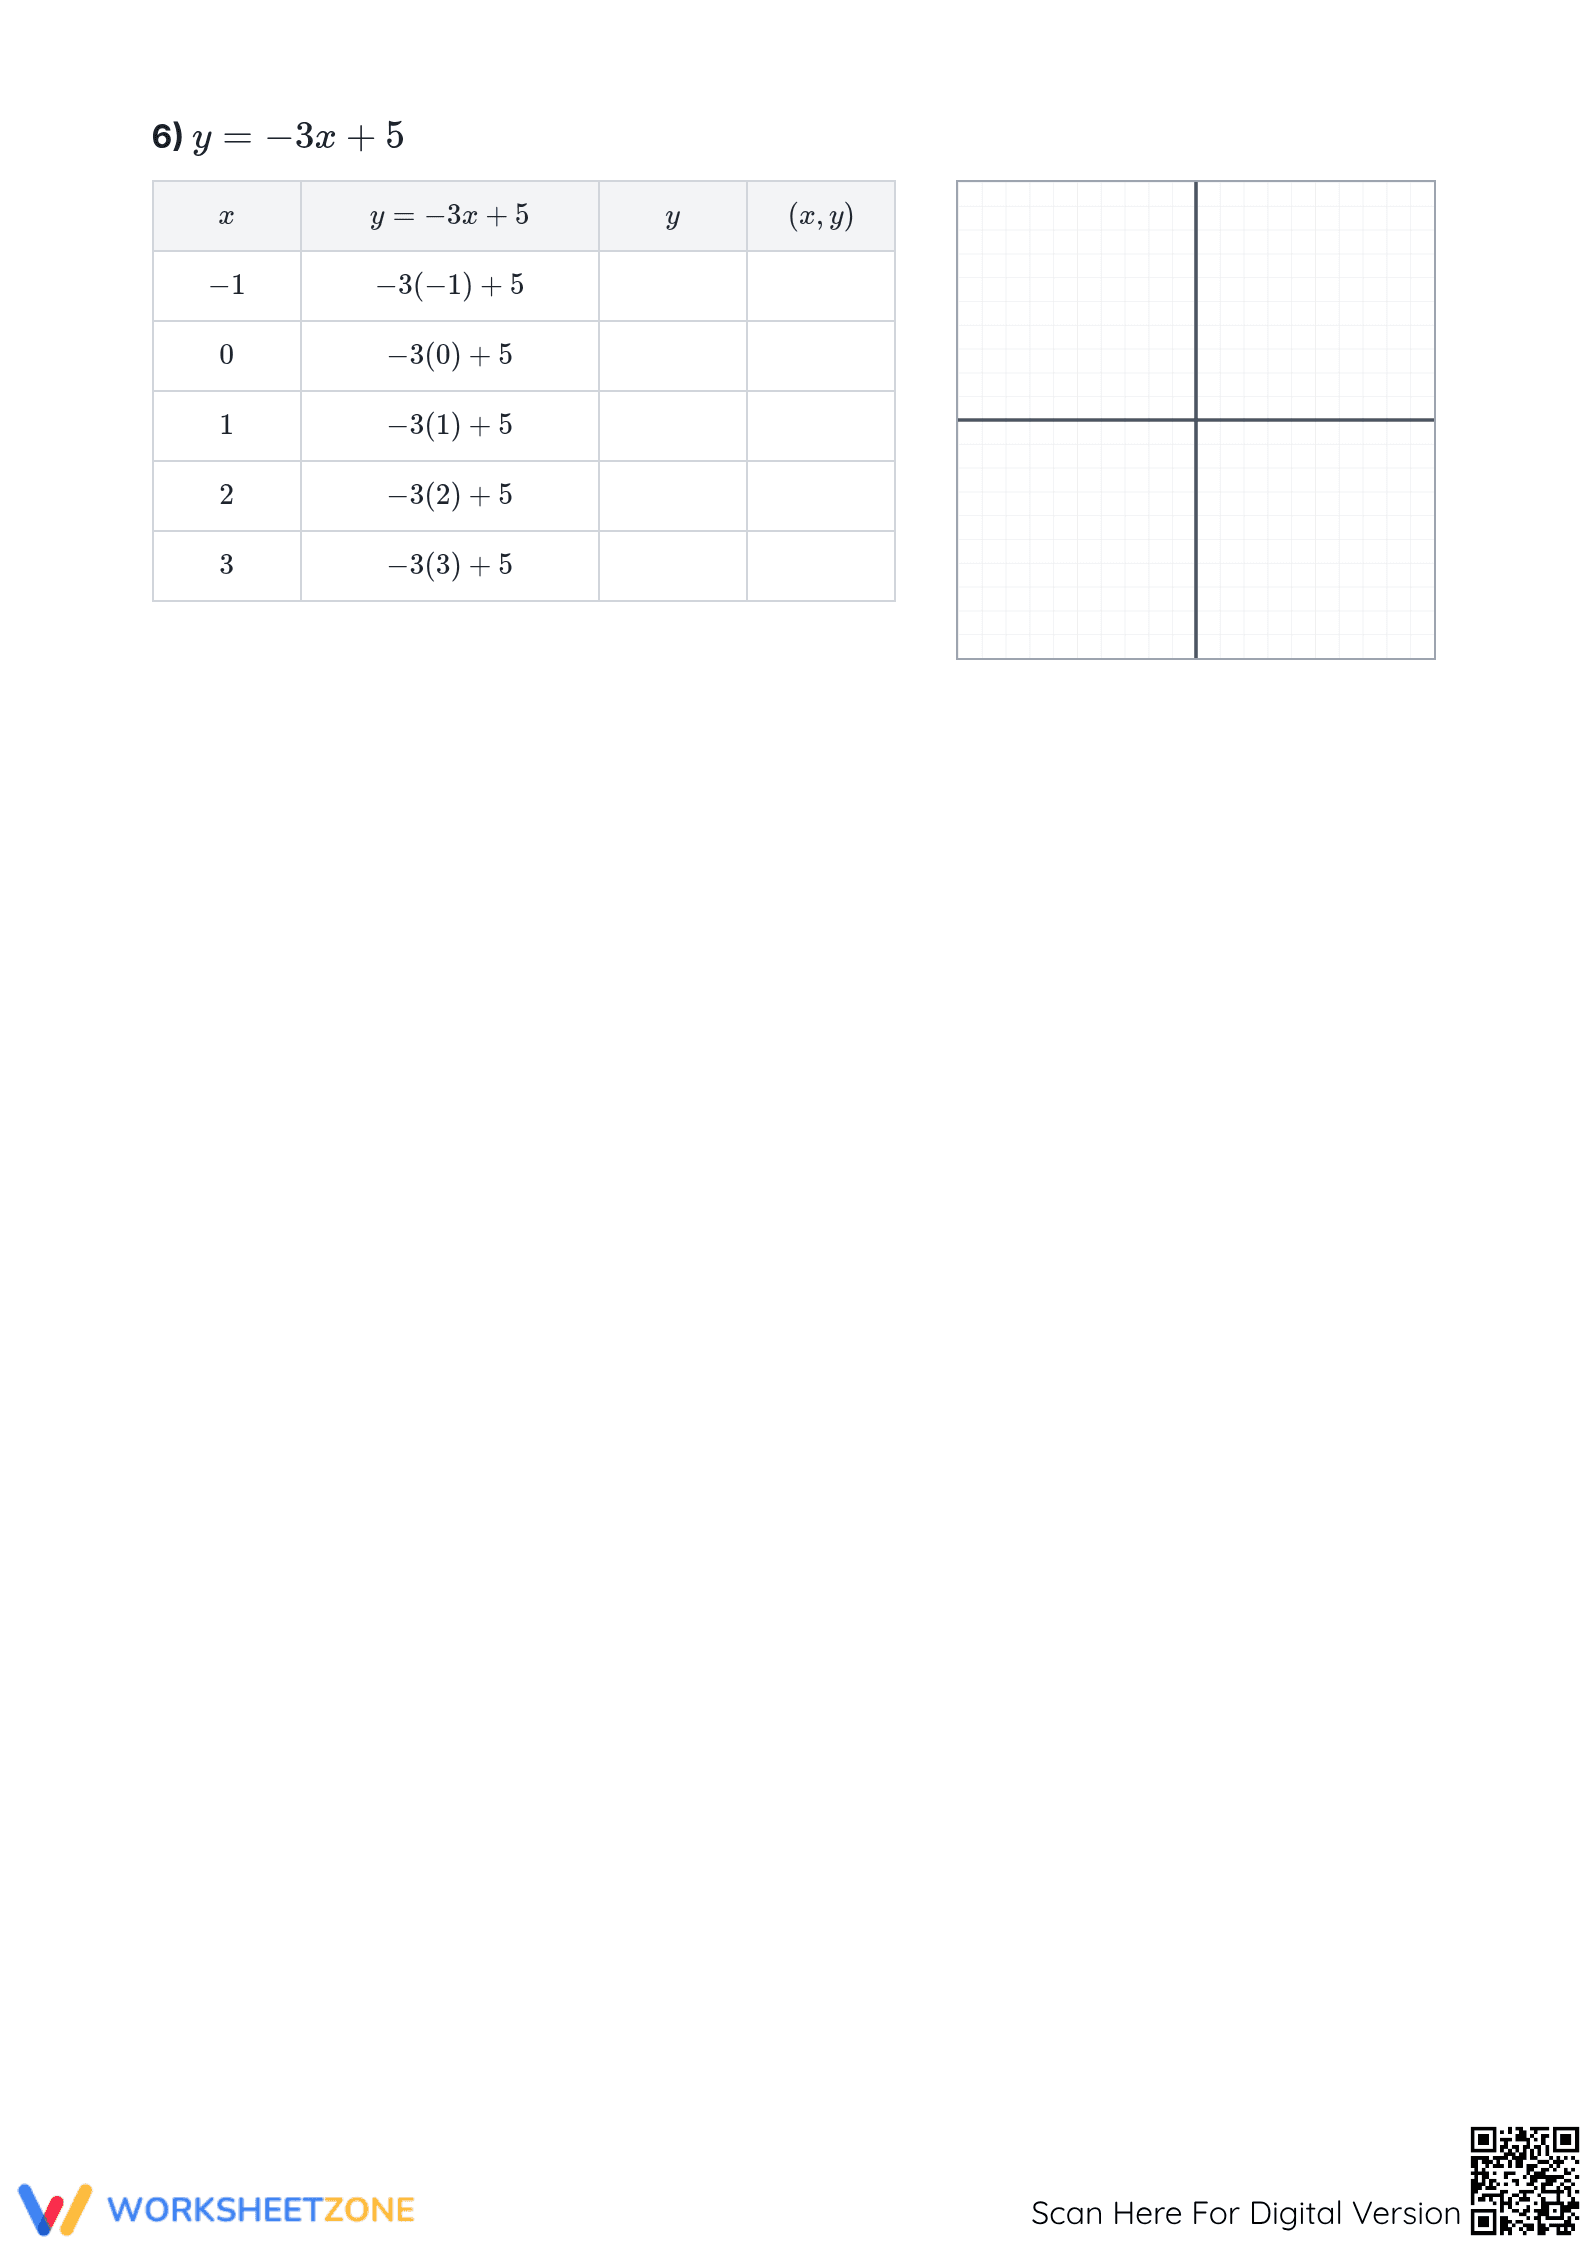
- Independent Practice: The final tasks introduce varying slopes and constants, challenging students to maintain precision without structural hints.
Standards Alignment
The primary focus of this worksheet is HSA.REI.D.10, which requires students to understand that the graph of an equation in two variables is the set of all its solutions plotted in the coordinate plane. Additionally, it supports 8.F.A.3 by having students interpret equations in y=mx+b form. Both standard codes can be copied directly into lesson plans, IEP goals, or district curriculum mapping tools.
How to Use It
This worksheet is best assigned after a direct instruction lesson on functions and the coordinate plane. Use it as a formative assessment during the "You Do" phase of a lesson to identify students struggling with integer operations or coordinate plotting. Teachers should circulate and observe if students are correctly identifying the direction of the line based on the sign of the slope.
Who It's For
Designed for Grade 9 Algebra students, this resource is also suitable for middle schoolers in advanced tracks or high schoolers needing remediation in coordinate geometry. It pairs naturally with a short video on slope-intercept form or an anchor chart demonstrating how to plot ordered pairs. Differentiation is achieved through the structured table format which prevents organizational errors.
The pedagogical approach used in this graphing linear equations worksheet aligns with the principles of effective math instruction as detailed in the RAND AIRS 2024 report on secondary mathematics. Research indicates that using multiple representations—switching between tables, equations, and graphs—is a high-leverage practice that significantly improves student retention of algebraic concepts. By requiring students to manually compute y-values before plotting, the resource reinforces the conceptual link between a function's numeric behavior and its geometric shape. This specific design ensures that students do not simply "copy-paste" points but instead internalize how the variable relationship dictates the position of the line on the grid. This rigorous yet accessible format makes it a staple for evidence-based classroom instruction and individual student mastery of HSA.REI.D.10 and 8.F.A.3, providing clear metrics for progress monitoring.