


Views
Downloads


Printable Graph Equation Detective Worksheet | Grade 9 Math
Paste this activity's link or code into your existing LMS (Google Classroom, Canvas, Teams, Schoology, Moodle, etc.).
Students can open and work on the activity right away, with no student login required.
You'll still be able to track student progress and results from your teacher account.
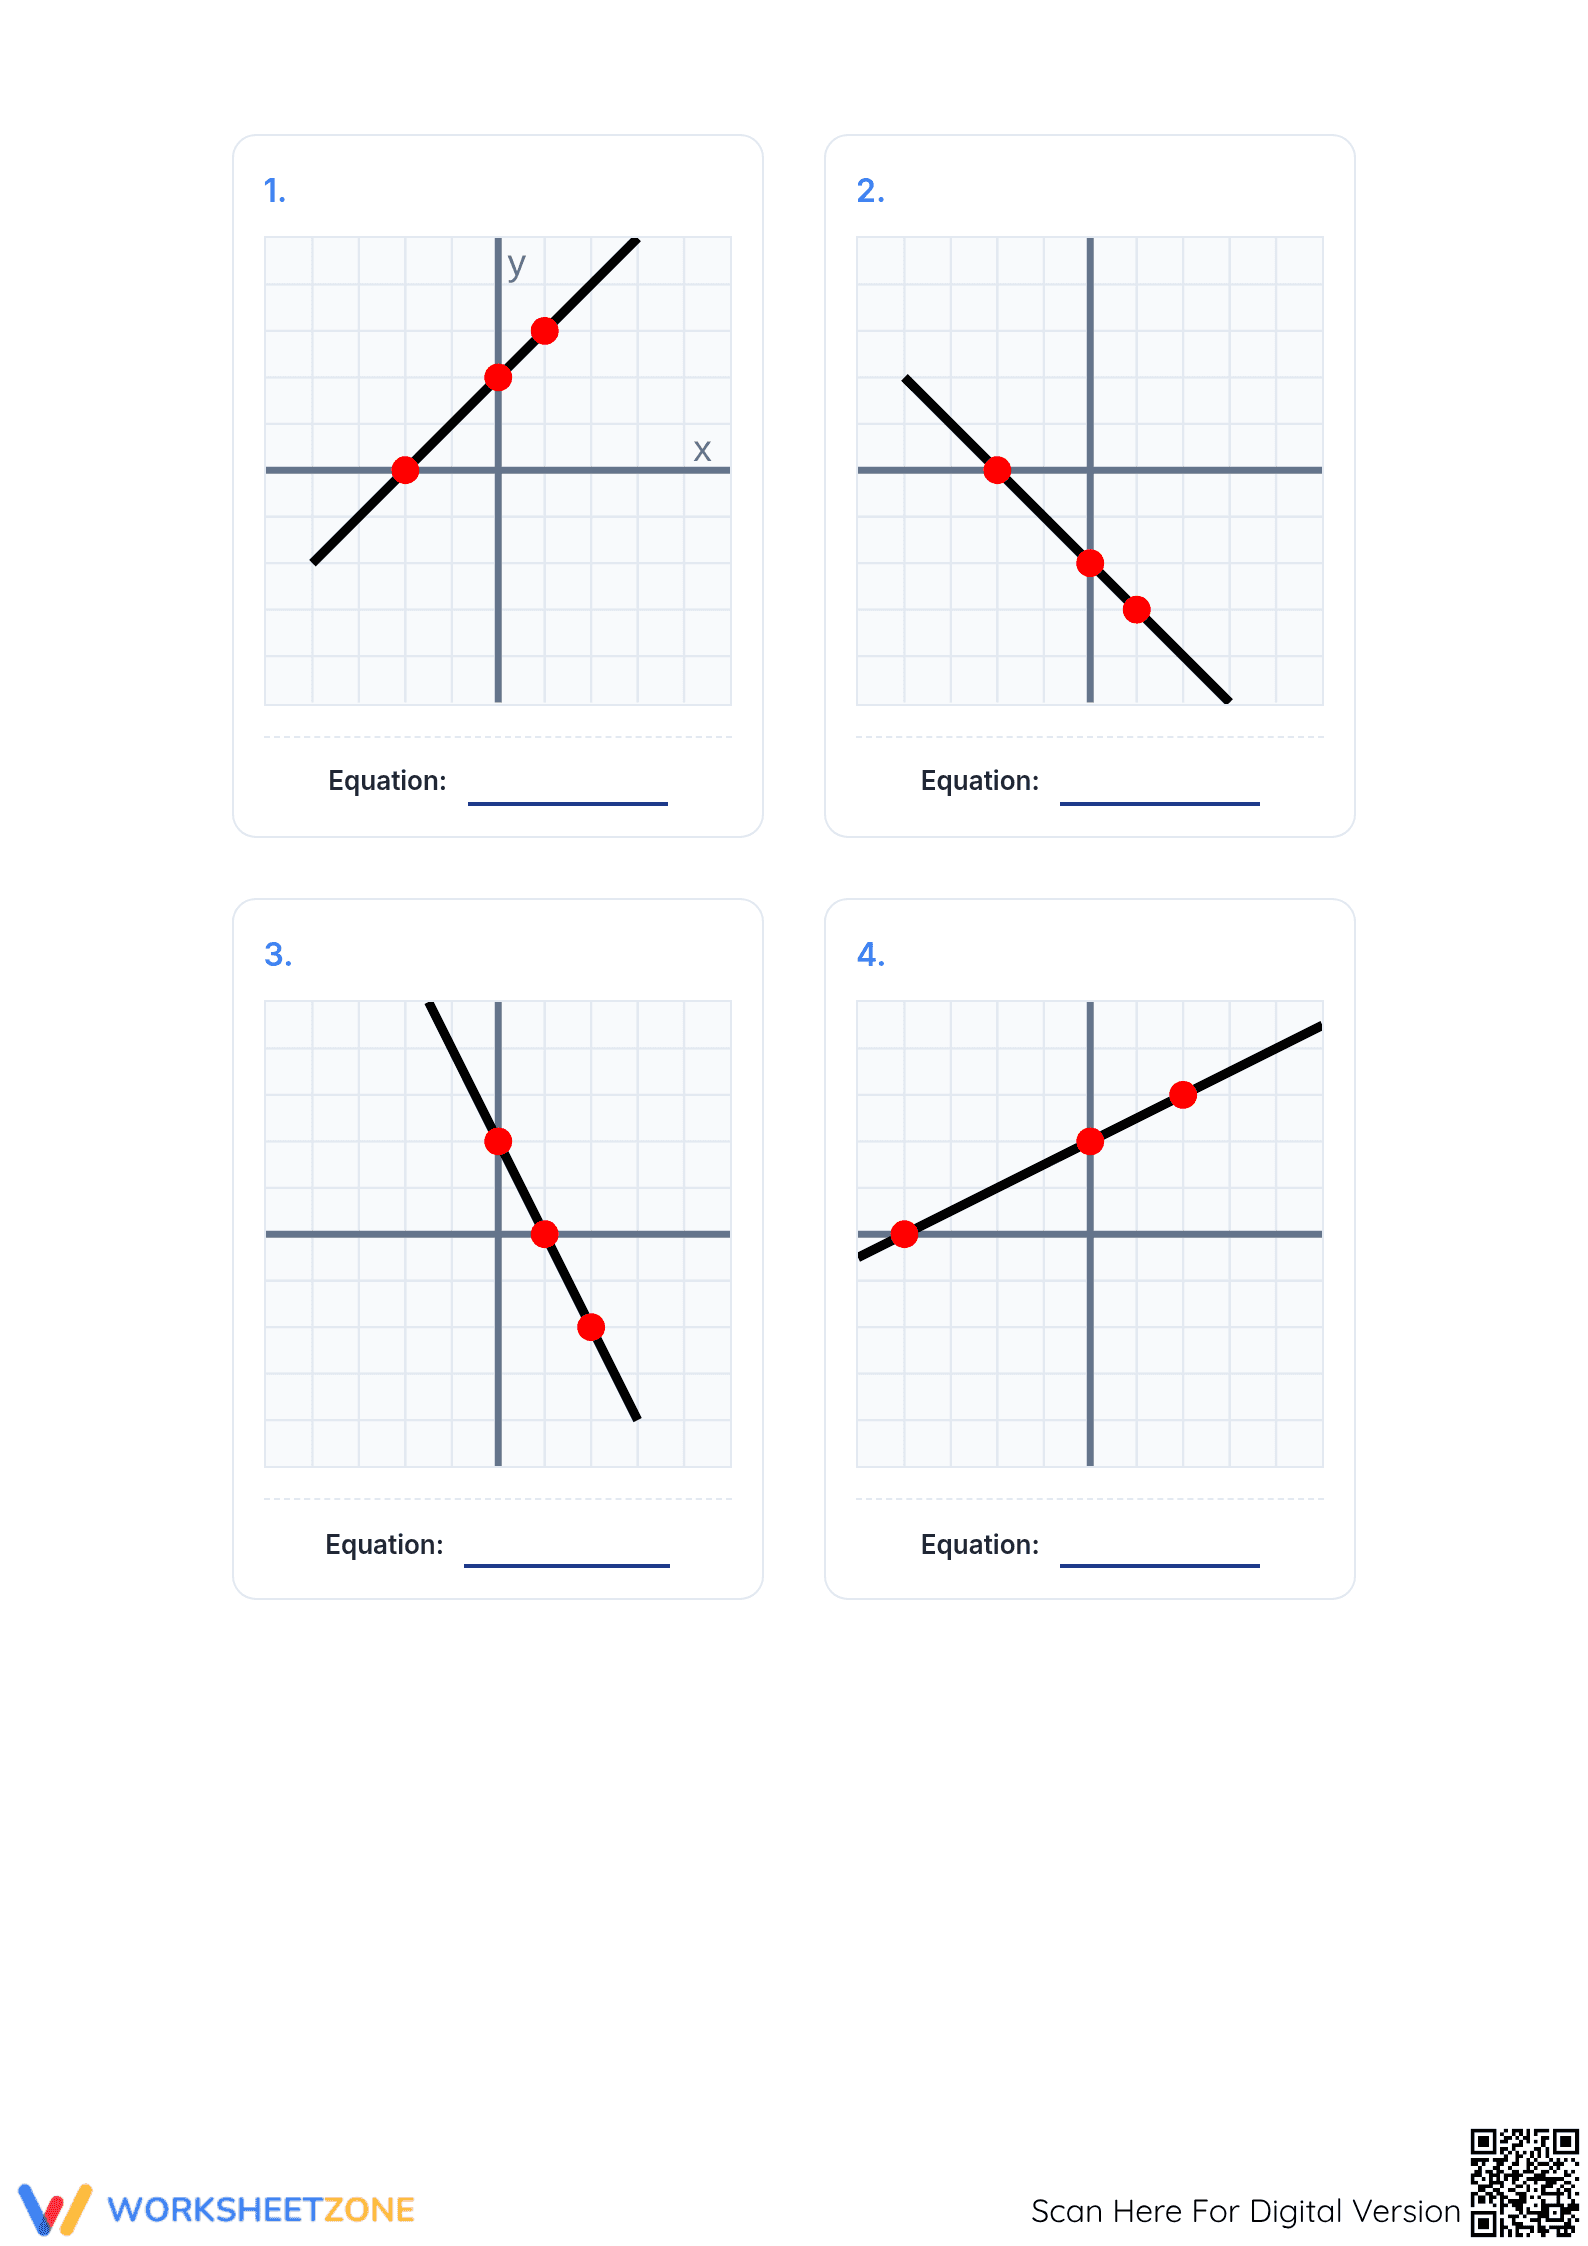
Identify linear functions with precision using this engaging "Graph Equation Detective" activity. Students analyze four distinct coordinate planes to match slope and y-intercept values against a provided equation bank. This resource transitions learners from visual recognition to algebraic proof, ensuring they can accurately interpret how constants and coefficients dictate the behavior of a line.
At a Glance
- Grade: 9 · Subject: Math
- Standard:
CCSS.MATH.CONTENT.8.F.A.3— Interpret the equation y = mx + b as defining a linear function- Skill Focus: Graph-to-Equation Matching
- Format: 3 pages · 5 problems · Answer key included · PDF
- Best For: Linear functions unit practice and review
- Time: 20–30 minutes
What's Inside
This 3-page PDF features a structured layout. The first page presents an Equation Bank containing eight linear equations in slope-intercept form, alongside a notes area for scratch work. The second page provides four coordinate grids with plotted lines and key points highlighted in red. A final bonus challenge page requires students to describe a graph for an unused equation, with a full answer key provided.
Skill Progression
- Guided Practice (2 tasks): Students use highlighted intercepts to identify the y-intercept (b) and calculate slope (m) by counting rise-over-run units.
- Supported Practice (2 tasks): Learners analyze graphs where the slope is fractional or negative, applying the y = mx + b framework to choose matches.
- Independent practice (1 task): The bonus challenge prompts students to visualize and describe a line based solely on its algebraic components.
This sequence follows the gradual-release model, moving from scaffolded visual cues to abstract reasoning.
Standards Alignment
The focus is CCSS.MATH.CONTENT.8.F.A.3, which requires students to interpret the equation y = mx + b as defining a linear function whose graph is a straight line. This worksheet also supports CCSS.MATH.CONTENT.HSA-REI.D.10 by reinforcing that the graph of an equation in two variables represents its solution set. Both standard codes can be copied directly into lesson plans or IEP goals.
How to Use It
Deploy this worksheet during the "You Do" phase of a lesson on slope-intercept form. It serves as an excellent formative assessment tool; teachers should observe if students are correctly identifying the direction of the line before calculating specific values. Expect completion within 25 minutes, making it an ideal exit ticket or homework assignment to verify student grasp of linear characteristics.
Who It's For
This resource is tailored for Grade 8 and 9 Algebra students, including those requiring visual scaffolds provided by the red "hit points" on the coordinate planes. It pairs naturally with a short-form instructional video on y = mx + b or a direct instruction lesson using an interactive whiteboard.
Fisher & Frey (2014) emphasize that visual representations are essential for students to internalize relationships between algebraic symbols and geometric counterparts. This "Graph Equation Detective" worksheet implements these strategies by providing clear coordinate planes that highlight critical intercepts, reducing barriers for diverse learners. By aligning tasks with CCSS.MATH.CONTENT.8.F.A.3, the resource ensures Grade 9 students build a rigorous foundation in linear modeling. Research indicates that high-quality practice on single standards accelerates mastery by allowing students to concentrate on specific procedural fluencies before complex applications. This PDF provides that focus, offering 5 tasks that require active interpretation of slope and intercept. The inclusion of a bonus challenge extends learning by asking students to predict visual outcomes from algebraic data. This standalone resource is an essential component for any secondary mathematics curriculum focusing on the properties of linear functions.