


0
Views
0
Downloads
0.0
0
Save
0 Likes
Garden Graphing Worksheet
0 Views
0 Downloads
Paste this activity's link or code into your existing LMS (Google Classroom, Canvas, Teams, Schoology, Moodle, etc.).
Students can open and work on the activity right away, with no student login required.
You'll still be able to track student progress and results from your teacher account.
Information
Description
What It Is:
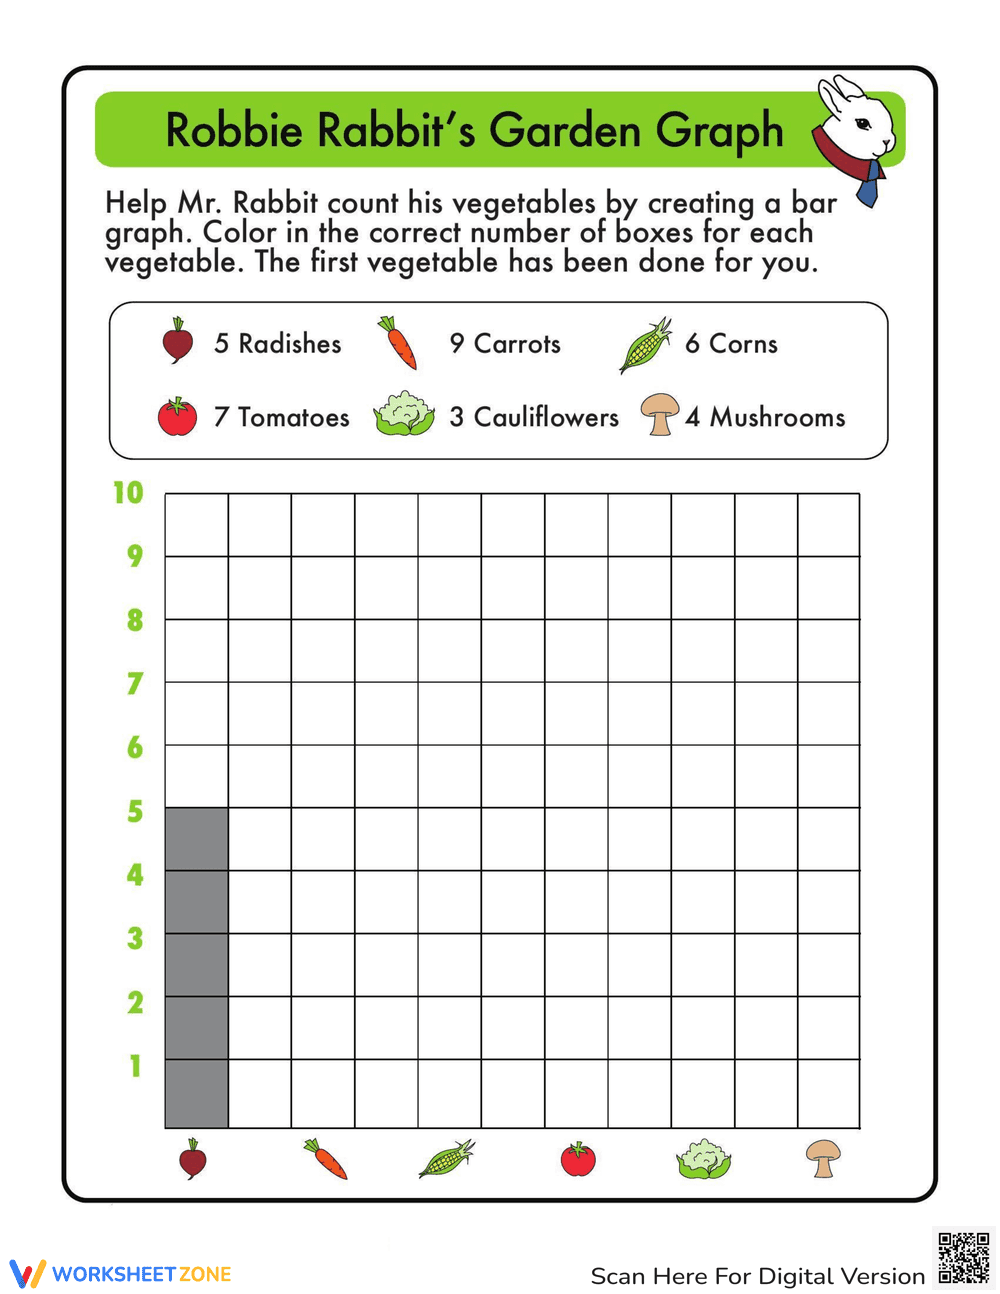
This is a worksheet titled 'Robbie Rabbit's Garden Graph' that helps children practice creating bar graphs. It features a grid with numbers 1-10 on the vertical axis and pictures of vegetables (radishes, carrots, corns, tomatoes, cauliflowers, and mushrooms) along the horizontal axis. The worksheet instructs the child to color in the correct number of boxes for each vegetable, creating a bar graph to represent the quantity of each vegetable. The radish bar has been completed to show 5 radishes.
Grade Level Suitability:
This worksheet is suitable for Kindergarten and 1st grade. It involves counting, matching numbers to quantities, and creating a simple bar graph, which are skills typically taught in these grade levels.
Why Use It:
This worksheet helps children develop early graphing skills, number recognition, and counting abilities. It visually reinforces the concept of representing data with a bar graph and allows for hands-on learning through coloring.
How to Use It:
First, have the child identify the number of each vegetable. Then, starting from the bottom of the graph, instruct them to color in the corresponding number of boxes for each vegetable, creating a bar. For example, for 9 carrots, the child should color in 9 boxes above the carrot picture.
Target Users:
This worksheet is designed for young children in Kindergarten and 1st grade who are learning about counting, data representation, and basic graphing skills. It is also helpful for students who need visual and kinesthetic learning activities.