In this lesson, students will use technology to help them grasp the concept of linear functions. Students will:
- work with applets.
- graph functions on a graphing calculator, and compare table values to graphs.
- create linear functions to graph using a graphing calculator.
- use the graphing calculator to compare several linear functions and record observations (leading to an early understanding of function transformations).
- in a Microsoft Excel spreadsheet, input functions, generate values, and analyze.
- examine linear and nonlinear spreadsheet data to compare the rate of change.
- How are relationships represented mathematically?
- How are expressions, equations, and inequalities used to quantify, solve, model, and/or analyze mathematical problems?
- How can mathematics help to quantify, compare, depict, and model numbers?
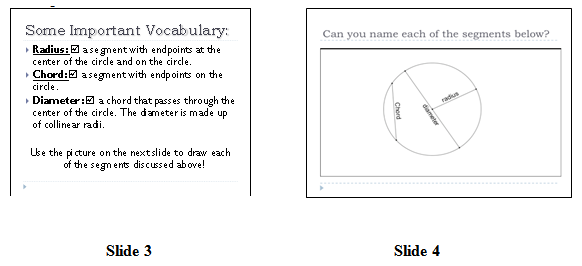
- Coefficient: In elementary algebra, the numerical part of a term, usually written before the literal part, as 2 in 2x or 2(x + y). In general, the product of all the factors of a term except a certain one (or a certain set), of which the product is said to be the coefficient. (For example, in 2axyz, 2axy is the coefficient of z, 2ayz the coefficient of x, 2ax the coefficient of yz, etc.; most commonly used in algebra for the constant factors, as distinguished from the variables.)
- Function: A relation where each input value is mapped/related to one and only one output value. In other words, for each input value, there is one and only one output value.
- Linear Function: A function with a constant rate of change, or slope; a function of degree one.
- Nonlinear Function: A function of a degree greater than one.
- Slope: Of a straight line, the tangent of the angle that the line makes with the positive x-axis.
- y-intercept: In a rectangular coordinate system, the distance from the origin to the point where the line, curve, or surface cuts the y-axis.
- Two Similar Graphs worksheet (M-8-3-3_Two Similar Graphs and KEY)
- computers with Internet access
- Microsoft Excel
- GeoGebra download: http://www.geogebra.org/cms/en/download (see Activity 2)
- graphing calculators
- grid paper
- In the graphing calculator activities, evaluating student performance will include demonstrating students the difference between operational errors in using the technology (miskeying, using an incorrect function, and other errors) and content-based errors.
- Observe and informally evaluate students' participation in class discussions.
- Formally assess student understanding using students' technology journals. Each journal must include enough detailed information, such as what the student was intending to do, what processes were used, what outcomes were achieved, and which sections needed to be revised and repeated.
Scaffolding, Active Engagement, Modeling
W: Students are asked to answer comparison questions about linear functions. The goal is to make students aware that there are strategies that can be utilized to make comparisons easier. Students use a variety of technological options to investigate and compare linear functions.
H: The open-ended exploration with applets aims to engage students. The engaging and challenging technology activities that follow are intended to keep students' attention and interest.
E: This class uses technology tools to accommodate visual, auditory, and tactile-kinesthetic learners. Individual instructor help is offered as needed. This lesson is self-directed to a great extent. Several learning resources are provided to help students explore linear functions. The principles in this lesson build on those from Lessons 1 and 2. They deal with linear functions. Students compare the equations, tables, and graphs of various linear functions and explain the similarities and differences. This activity provides a basic knowledge of how the function rule is expressed in tables and graphs for a number of functions.
R: During open-ended exercises, students should reflect and revise their thinking. They are asked to summarize their findings as they continue to work. They can rethink and broaden their conclusions as they progress.
E: Students should continually test their comprehension of linear functions while comparing them, evaluating data, and acquiring a conceptual sense. You can evaluate students informally by monitoring their work and asking questions as they experiment with technology. Formal evaluation is conducted by reviewing each student's technology journal, which summarizes the ideas covered in the class activities.
T: Use the Extension suggestions to personalize the lesson to the requirements of your students. The routine is appropriate for any student. The small-group activity is appropriate for students or the full class as a means of additional learning or practice. The expansion activity is appropriate for students who have demonstrated proficiency and are ready for a more challenging task.
O: The lesson is divided into two sections. It might be suitable to spend one class period to each section, or to complete the parts using the graphing calculator on one day and the computer applications on another. The lesson starts with a review of linear functions, function rules, and graphs. When a new technology is introduced, a brief introduction and some direct instruction will be given. In large part, students will work at their own pace and discover many of the principles for themselves. Students will be invited to document their observations and submit a technology notebook at the end of the lesson. As the lesson progresses, the teacher will provide guidance, monitor significant topics, and summarize key points as the lesson progresses.
As students enter the room, write a list of function rules on the board, similar to the one below:
1. y = 2x
2. y = -2x
3. y = 2x + 1
4. y = 2x – 6
5. y = -\(1 \over 2\)x + 1
Ask students to make as many observations as possible about the five equations and what they could reveal about the functions they represent. Invite multiple students to share their observations and conjectures. Don't agree or disagree with the conjectures. Explain to students that they will be able to use technology to identify quick and effective ways to perform similar comparisons and prove their own conjectures correct or incorrect. Technology will assist students in discovering concepts on their own by allowing them to quickly compare a large number of equations, tables, and graphs.
"Each of you should know that for the next two to three days, you will be writing a technology notebook before we start our exploration. You will summarize your learnings in your technology journal at the end of each new section of the lesson. Make sure your entries are very clear by stating what type of technology you were using, what types of problems you did, and what you learned from the experience. To make your arguments clear, please utilize both descriptions and diagrams. With the words "Technology Journal" in the center and your name, class period, and current date underneath, you can start your journal right now. For the back cover, you can use a blank sheet of paper. Place six grid paper sheets between the front and back covers. In the future, if necessary, you can add more sheets. Attach a staple to the top left corner of your diary or the full left side."
Part 1: Developing and Examining Linear Functions
Enhancing students' conceptual understanding of the topic is the main objective of this part of the lesson, which focuses on using technology in the study of linear functions. Technology is not intended to replace manual calculations and graphing. Rather, technology makes it possible to analyze more data and compare different functions more quickly. Start this part of the lesson with the use of computer. There should be a computer for each student or pair of students.
Applet Explorations
With two separate applets, students can begin their technological discovery of functions.
First, students can review the concept of a function using NLVM's Function Machine applet, which can be found at: http://nlvm.usu.edu/en/nav/frames_asid_191_g_3_t_2.htmlfrom=category_g_3_t_2.html
Students can then graph single or multiple (up to three) linear and nonlinear functions using NLVM's Grapher applet, which can be found at http://nlvm.usu.edu/en/nav/frames_asid_109_g_3_t_2.html?open=activities&from=category_g_3_t_2.html
The Grapher applet allows students to color code functions, restrict domains (if students inquire), and define window parameters much like they would on a graphing calculator.
Give them time to explore the values of their choice in each applet for many minutes.
Encourage students to record a section for every applet in their technology journals. Every new part in the journal should have a title. Encourage students to take notes and make sketches of some of the problems they encounter when working on the applet, as this will make it easier for them to finish their journals later on.
As you go around the room, note the progress of the students. Respond to questions about technology and content when they come up. Ask students questions that will help them comprehend the ideas they are exercising more thoroughly. Some questions that may be asked are:
"Are you able to enter values into a table?"
"Are you able to adjust the window's size?"
"Are you able to modify the interval?"
Invite a few students to share their findings and observations when the activity is over. Provide a summary of the findings and any that were overlooked but ought to have been found.
Excel Spreadsheet Explorations
An Excel application is available for several graphing calculator types. As you start working with the Excel spreadsheet, walk the students through entering linear functions. After students understand how to input the functions, they will be able to look at the values that are produced.
With the input procedure for a basic linear function, begin the instructions. Select this option if you can show the students the instructions on your computer.
Go through the following procedures with students. Keep the list visible so you can refer to it later.
1. Select a linear function to investigate, such as y = x + 2.
2. Type 1 in cell A1. In cell A2, type the function "= A1 + 1". Proceed to drag and copy this formula down to cell A20. This code will fill the first 20 spaces with the values 1 to 20, which will serve as your x-values.
3. In cell B1, type the function "= A1 + 2". This function expresses a linear function x + 2. Drag and copy the function of that cell downwards to B20.
4. Column A contains the x-values, while column B contains the y-values.
"We observe a constant rate of change of \(1 \over 1\). Therefore, the slope is 1. The y-intercept can be determined as (0, 2), as 1 less than 3 is 2. It is possible to make a comparison between the y-intercept of 2 and the +2 in the equation. We can also compare the slope of 1 with the coefficient of 1 in front of x. The graph of this function can be visualized as a straight line with a moderate slope and an intersection with the y-axis at the point (0, 2)."
Before continuing, make these ideas clear. Examine each student's ability to use this function on their spreadsheet by moving around the classroom. Allow students to ask questions.
"Let's input a linear function that is a little bit more complicated now. Also, suppose we want to use negative integers to begin our x-values before 0."
Go through these steps with the class:
1. Select a linear function to analyze, such as y = −3x + 9.
2. Enter the value -5 in cell A1; type the function "=A1 + 1" in cell A2, and then extend and duplicate that cell's functions down to A20. This allows us to start our x-values at -5 instead of 0 or 1.
3. Type the function "-3*(A1)-9" into cell B1. This equation illustrates a linear function in the form of y = -3x - 9. Drag and copy the function of that cell downwards to B20.
4. The values in column A correspond to the x-values, whereas the values in column B correspond to the y-values.
"This time, we see that there is a constant rate of change of -\(3 \over 1\). The slope is, therefore, -3. The y-intercept is (0, −9). We can make a comparison between the y-intercept of -9 and the -9 in the equation. Additionally, we can compare the slope of -3 with the coefficient of -3 in front of x. If we consider how this graph would look, we realize that we would have a line with a negative slope that would be steeper than y = -x."
Now is a good time to use this graph's angle to compare how steep graphs with slopes of 1 and -1 are.
"The graph meets the y-axis at (0, -9). That is, 'the y-intercept is -9'."
Activity 1: Using Excel
Request that students write five distinct linear functions. They need to use the spreadsheet's formula features to come up with at least ten x- and y-values for each. Give students instructions on how to examine the patterns in the values for each function. Students will pick three tasks to write about. In their technology journal entry for this task, they should write down the function rule (equation), the corresponding x- and y-values, and how they were analyzed. All significant attributes should be discussed by students, such as slope, positive or negative slope, line steepness, and y-intercept.
GeoGebra Exploration
Download the free GeoGebra software from http://www.geogebra.org/cms/en/download
Use this software to illustrate how to compare equations, tables, and graphs. GeoGebra functions somewhat like a graphing calculator.
Enter a function rule and explore the resulting table and graphed data as you demonstrate.
Activity 2: Using GeoGebra
Provide each student with three specific rules to use, or ask them to write and enter three function rules (different from the ones on the Excel spreadsheet). They should record the function rules, tables, and graphs in their technology journals, along with an analysis similar to those written for the Excel problems.
Note: GeoGebra is better than the graphing computer in a number of ways, such as letting you name the function and its parts, graph and label points on the line, and color-code more than one function at the same time. After using the graphing calculators, you might want to go over or show these benefits again.
Graphing Calculator Exploration 1
"The graphing calculator can be used to examine x and y tables and graphs of functions that are linear. A simple transfer between screens allows for easy comparisons between the function equation, table, and graph. Another useful tool for rapidly focusing on particular numbers is the "Table Set" feature. You need to have experience constructing different functions and looking at their representations in addition to having experience looking at functions that are already given to you to become proficient with the graphing calculator."
Start by showing how to examine several functions. Permit students to use their own graphing calculators as they work along with you. It would be ideal if you could project what you are doing.
"You won't be provided any initial knowledge regarding the type of the function. The ability to identify functions as linear or non-linear is crucial. In addition, the ability to recognize nonexamples is also an important skill."
Set up a list of functions that are comparable to the ones shown below.
Use these steps to demonstrate:
1. Go to the "y=" screen. Make any listed functions clear. Disable plots.
2. On the right side of "y=," enter the function. Teach your students how to use the key to enter the number x and, if necessary, the negatives and exponents.
3. Choose whether you want to view first by pressing the 2nd button and Table or the Graph button alone.
4. To adjust the table's beginning point and/or interval range, press 2nd and Window (TBLSET).
"Let's input each function and examine the resulting table and graph. You can look at the graph and table in any order you choose. All three of these representations will be compared. In particular, we are looking for similarities, as well as presence (or absence) of a constant rate of change, or a constant slope."
1. Display each function's entry on the "y=" screen, along with every table and graph. Make comparisons. Identify which of the following functions are linear: the second and the fourth only have a constant rate of change and constant slope.
2. Encourage students to make connections between the graph's slope, also known as the \(rise \over run\), the table's change in y-values (the ratio of the change in y-values to the change in x-values, when not examining terms in sequence), and the slope, or coefficient of x, as expressed in an equation.
3. Make connections between the highest degree of one on the x in each linear equation with the constant difference between terms found in the table, and the resulting line on the graph. Encourage accurate word usage while discussing linear and nonlinear functions for each of the three representations.
Discuss how the first and fifth functions are not linear. For those who are interested, you can use the term quadratic to describe an equation that resembles a parabola, but for the sake of this discussion, it is not necessary.
Talk about the attributes of the function. The function experiences a nonconstant rate of decline and then an equal nonconstant rate of growth. Highlight the degree of the equation and make the connection between that degree and the nonlinearity to the nonconstant rate of change in the table and graph. You can ask, "What would the equation, table, and graph look like if either of these functions were negative (that is, if the \(x^2\) term had a negative coefficient)?" to continue the conversation.
Talk to students about how the third function is also a function. Just proving that the function is nonlinear is more significant than whether or not they can identify it as cubic. Apply the same methods of questioning and discussion as you did with the quadratic functions. Linear functions are said to be degree one. Quadratic functions are degree two or second degree. Cubic functions are degree three or third degree.
Activity 3: Using a Graphing Calculator—A
Provide a chart with a number of specific linear and nonlinear functions. Students should identify the type of function and provide evidence for their answer by using features or properties from each of the four representations (equation form, table, text, and graph). students should explain in detail how each depiction demonstrates the function's linearity or nonlinearity. Students' technology journals should have entries for three of these functions and the analyses that go along with them.
Activity 4: Using a Graphing Calculator—B
Students will design their own set of linear functions in this exercise.
"In your technology journal, name three linear functions based on your knowledge of them. Give the equation form for each linear function. Show a part of the table of numbers and draw a correct picture of the graph. Lastly, emphasize the consistent rate of change in each representation. Discuss whether the table or graph is of more value to you and provide supporting reasons."
Students should understand that when using the graph or when trying to pinpoint specific values that is difficult to obtain at a glance, the table may be more helpful. If you want a fast understanding of the steepness, direction, and intercepts, the graph might be more useful.
Ask each student to give one example to the class if there is time.
Real-life Linear and Nonlinear Data Sets
Ask students to apply their knowledge of the properties of linear and nonlinear functions as you wrap up this section of the lesson. Without the use of technology, can students categorize a number of real-world data sets as linear or nonlinear?
Create or find at least four representative linear and nonlinear data sets (two of each kind) before starting this section of the lesson. For instance, you might create a list of details for a monthly cell phone bill (the amount of which depends on how many minutes you use). Tracking and showing the speed of someone jumping rope as a function of time is one way to deal with nonlinear data . The speed will drop when the jumper fatigues and is likely to fluctuate rather than stay precisely constant.
Give students a task to look at each data set and determine whether it is linear or not. Students will also connect the graph's appearance and the function's characteristics to the problem's context for each batch of data. Students must relate what is happening in the real problem at hand to the overall appearance of the data collection. When it comes to cell phone costs, for instance, the y-intercept can stand for the flat-rate monthly cost. and the slope for the amount charged per minute of usage. Students should understand that there is not a constant rate of change for nonlinear functions and should explain how this is reflected in the function description, data, and graph.
Depending on time availability, this task may be completed in class or as a homework project. Students can either finish this as a stand-alone task or record their replies in their technology diaries.
Part 2: Making Linear Function Comparisons
As they compare several linear functions in this section of the lesson, students note any similarities, contrasts, or subtleties they find between the functions. This promotes an early comprehension of function transformations (steepness of slope, positive/negative, etc.).
Graphing Calculator Exploration 2
"Let's compare these two graphs before we start the next exercise."
Make copies of the Two Similar Graphs worksheet (M-8-3-3_Two Similar Graphs and KEY) for students to use in comparing and contrasting the two sets of graphs.
"The graphs here are rather similar. What have you observed?" (Students should understand that both are positive, linear, and have a y-intercept of (0, −2). Additionally, students ought to notice that the first graph is marginally steeper than the second.)
"What do you think the equation for the second graph might look like, given that it is not as steep as the first? After you do the next task, you will know the answer to this query." (Students should understand that the slope coefficient will be smaller on the less steep graph.)
Activity 5: Using a Graphing Calculator—C
Write the functions listed below on the board.
Ask students to use the graphing calculator to analyze each linear function. It is required of the students to review and document the tables and graphs in their technology journals. students should note the distinctions, parallels, and subtleties that exist between and among the various functions, as well as their observations regarding the steepness of the functions (moderately steep, more or less steep, positive, or negative). Additionally, they ought to record which y-intercepts are positive or negative.
Give students the assignment to write a summary paragraph in their notebooks that includes observations about the graph, such as how the slope of the graph and the coefficient size relate to each other, and how the constant term (such as −4 or +2) is represented. For students who are up for the task, further concepts can be incorporated.
Before picking up their journals, give students five to ten minutes to finish their entries. After looking over the technological journals, decide which extension activities are appropriate for your class's individual students.
Extension:
Routine: Talk about how learning and using the right vocabulary terms are crucial for effectively communicating mathematical concepts. All of the exercises and observations made during this class ought to be documented in the technology journals of the students. Ensure that students have access to grid paper so they can add pages as needed. Bring up examples of the slope, constant rate of change, and functions that you have seen this school year. Request that students bring examples of linear function graphs and examples they have seen outside of the classroom so that you can explore the functions' applications and meanings in each specific scenario. Encourage students to use technology to continue investigating features on their own schedules. Show off any additional samples that students print off and bring to class. Students must utilize suitable language in both written and spoken responses.
Small Group, Review: Ask students to list the benefits and drawbacks of being given only one of the following forms of a function: equation, table, graph, or description.
Ask students to identify the function form (equation, table, graph, or description) that helped them the most during the class and to justify their choice. As a class, spend a few minutes discussing the thoughts of the students.
Expansion, Transformational Thinking: Students may conduct more research on various function types utilizing any of the technological resources provided in the course.
- Ask students to look at the properties of functions that are moved to the left or right. The students will examine the function forms that produce linear functions with x-intercepts greater than and less than 0.
- Students who are naturally curious may investigate further nonlinear functions to see how a nonlinear graph and table differ from a linear function's graph and table. Students can come across an absolute value function and understand that it is made up of linear functions.
Functions and Technology (M-8-3-3)
In this lesson, students will use technology to help them grasp the concept of linear functions. Students will:
- work with applets.
- graph functions on a graphing calculator, and compare table values to graphs.
- create linear functions to graph using a graphing calculator.
- use the graphing calculator to compare several linear functions and record observations (leading to an early understanding of function transformations).
- in a Microsoft Excel spreadsheet, input functions, generate values, and analyze.
- examine linear and nonlinear spreadsheet data to compare the rate of change.