


Views
Downloads
Printable Advanced Pictogram Worksheet | College Math
Paste this activity's link or code into your existing LMS (Google Classroom, Canvas, Teams, Schoology, Moodle, etc.).
Students can open and work on the activity right away, with no student login required.
You'll still be able to track student progress and results from your teacher account.
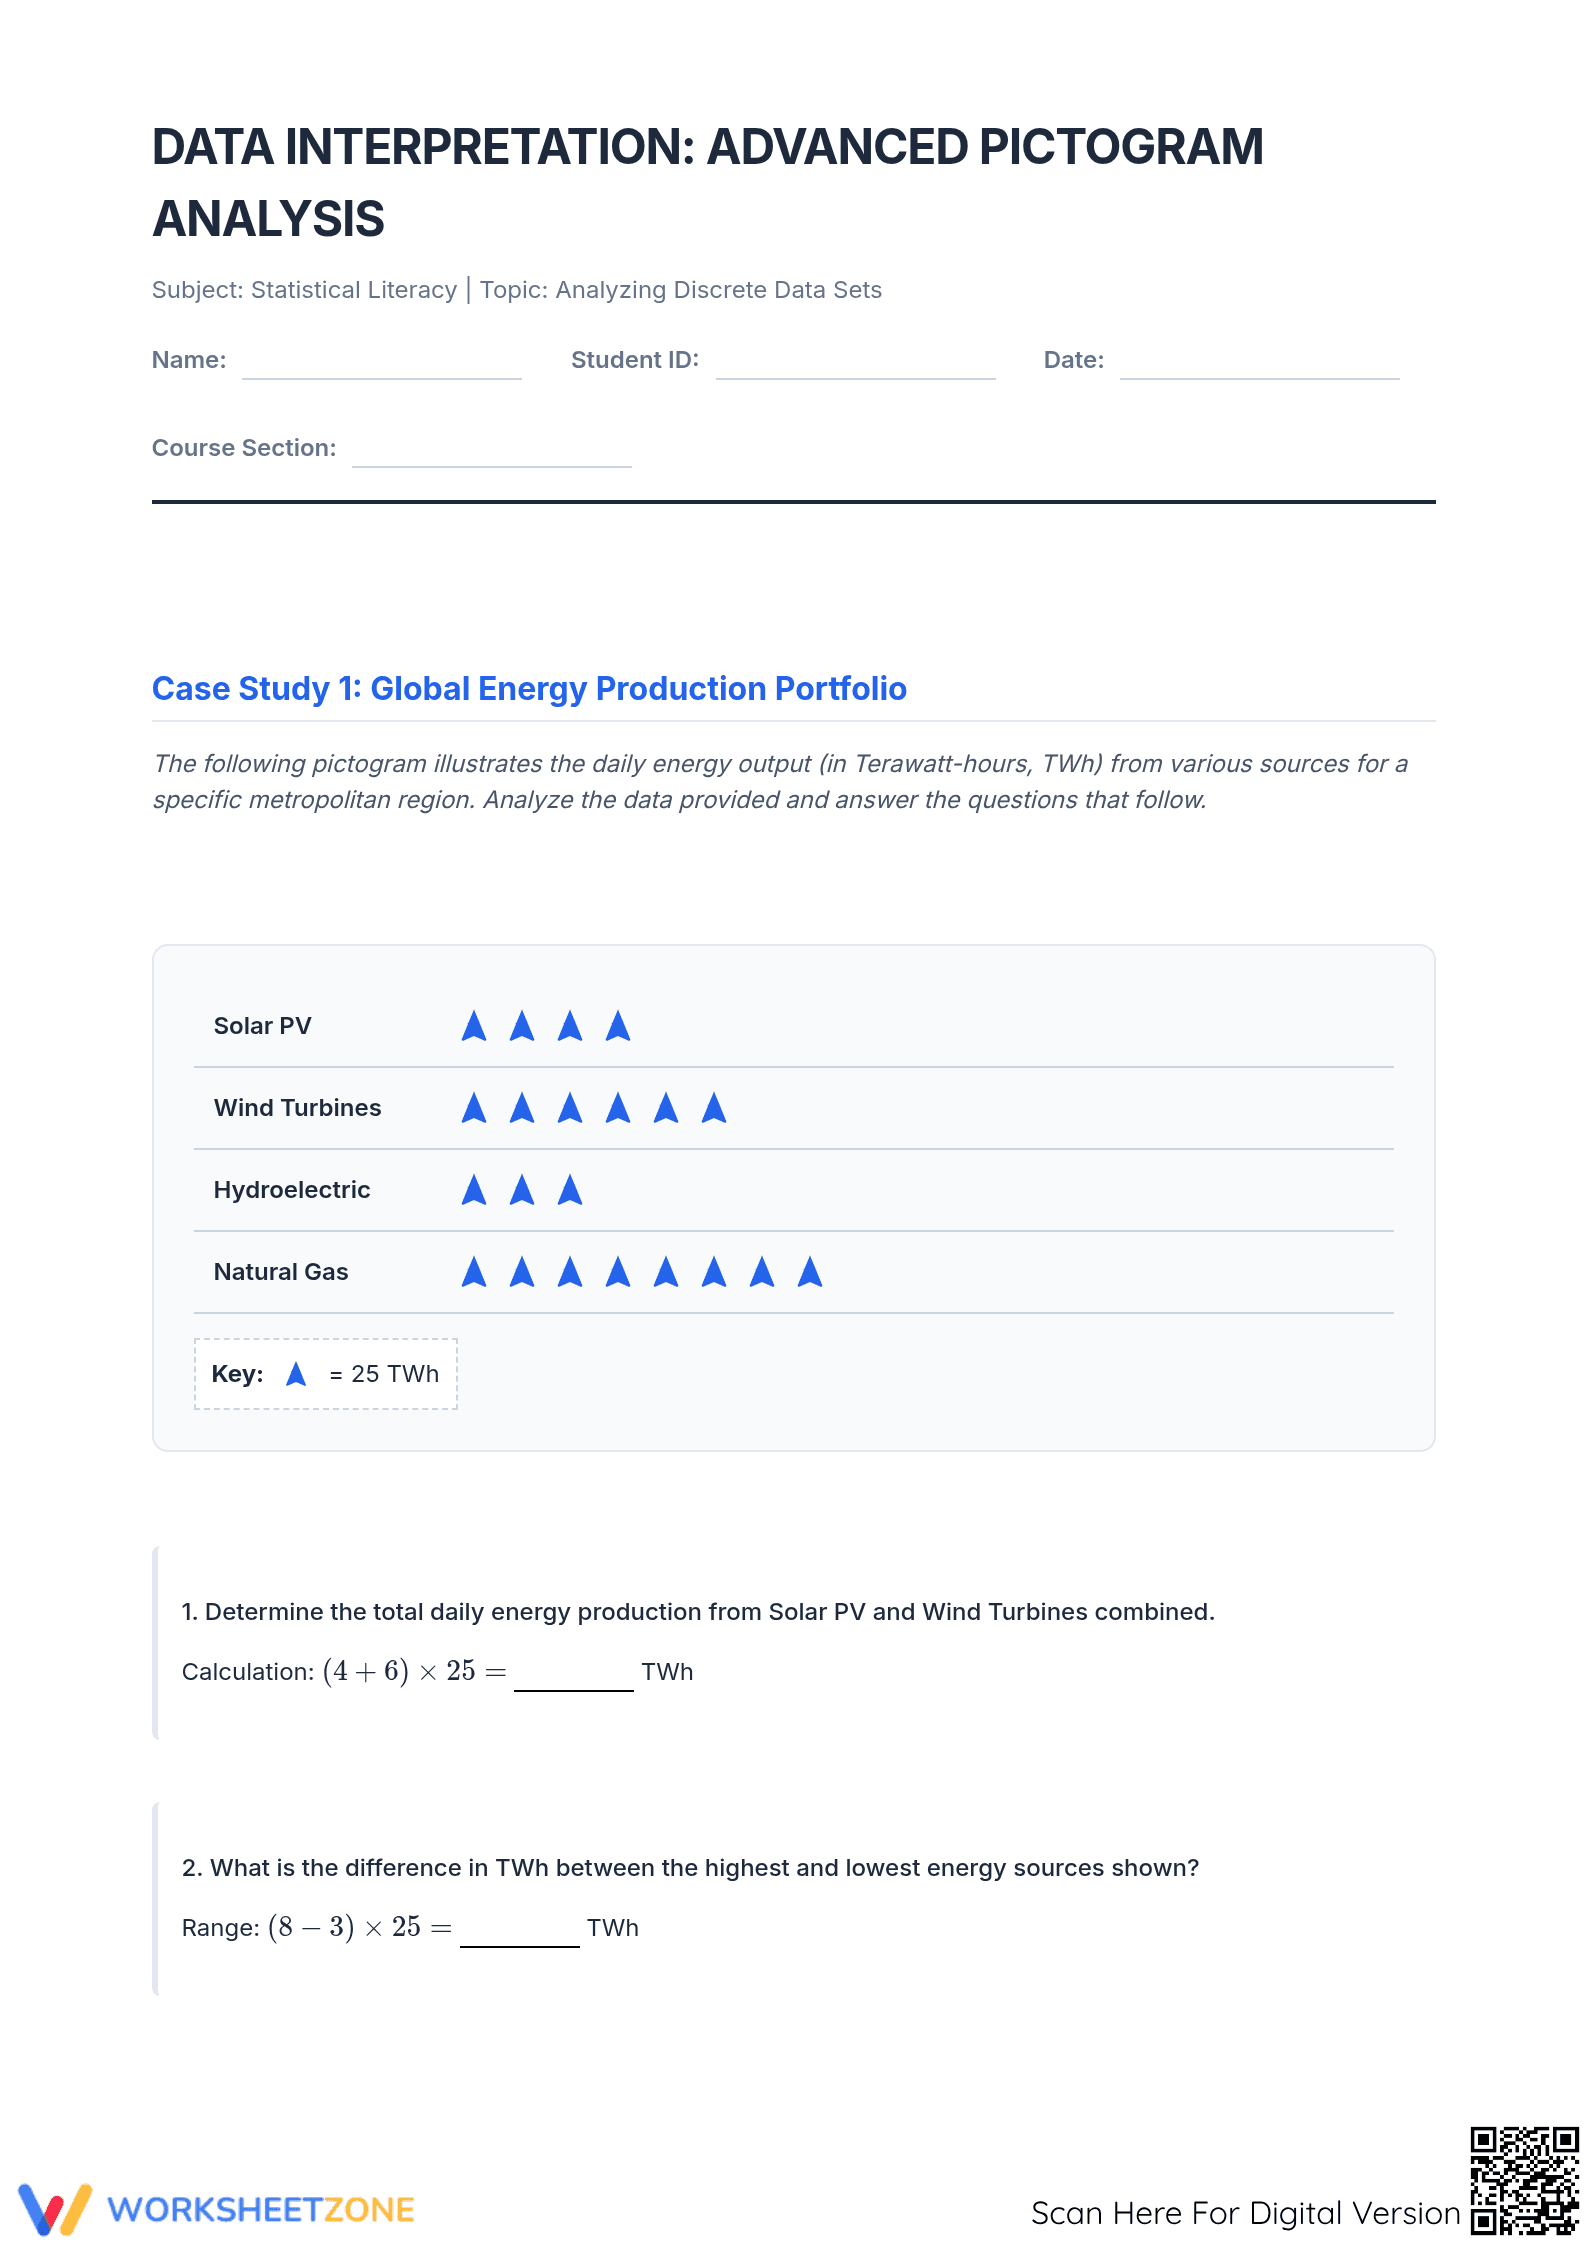
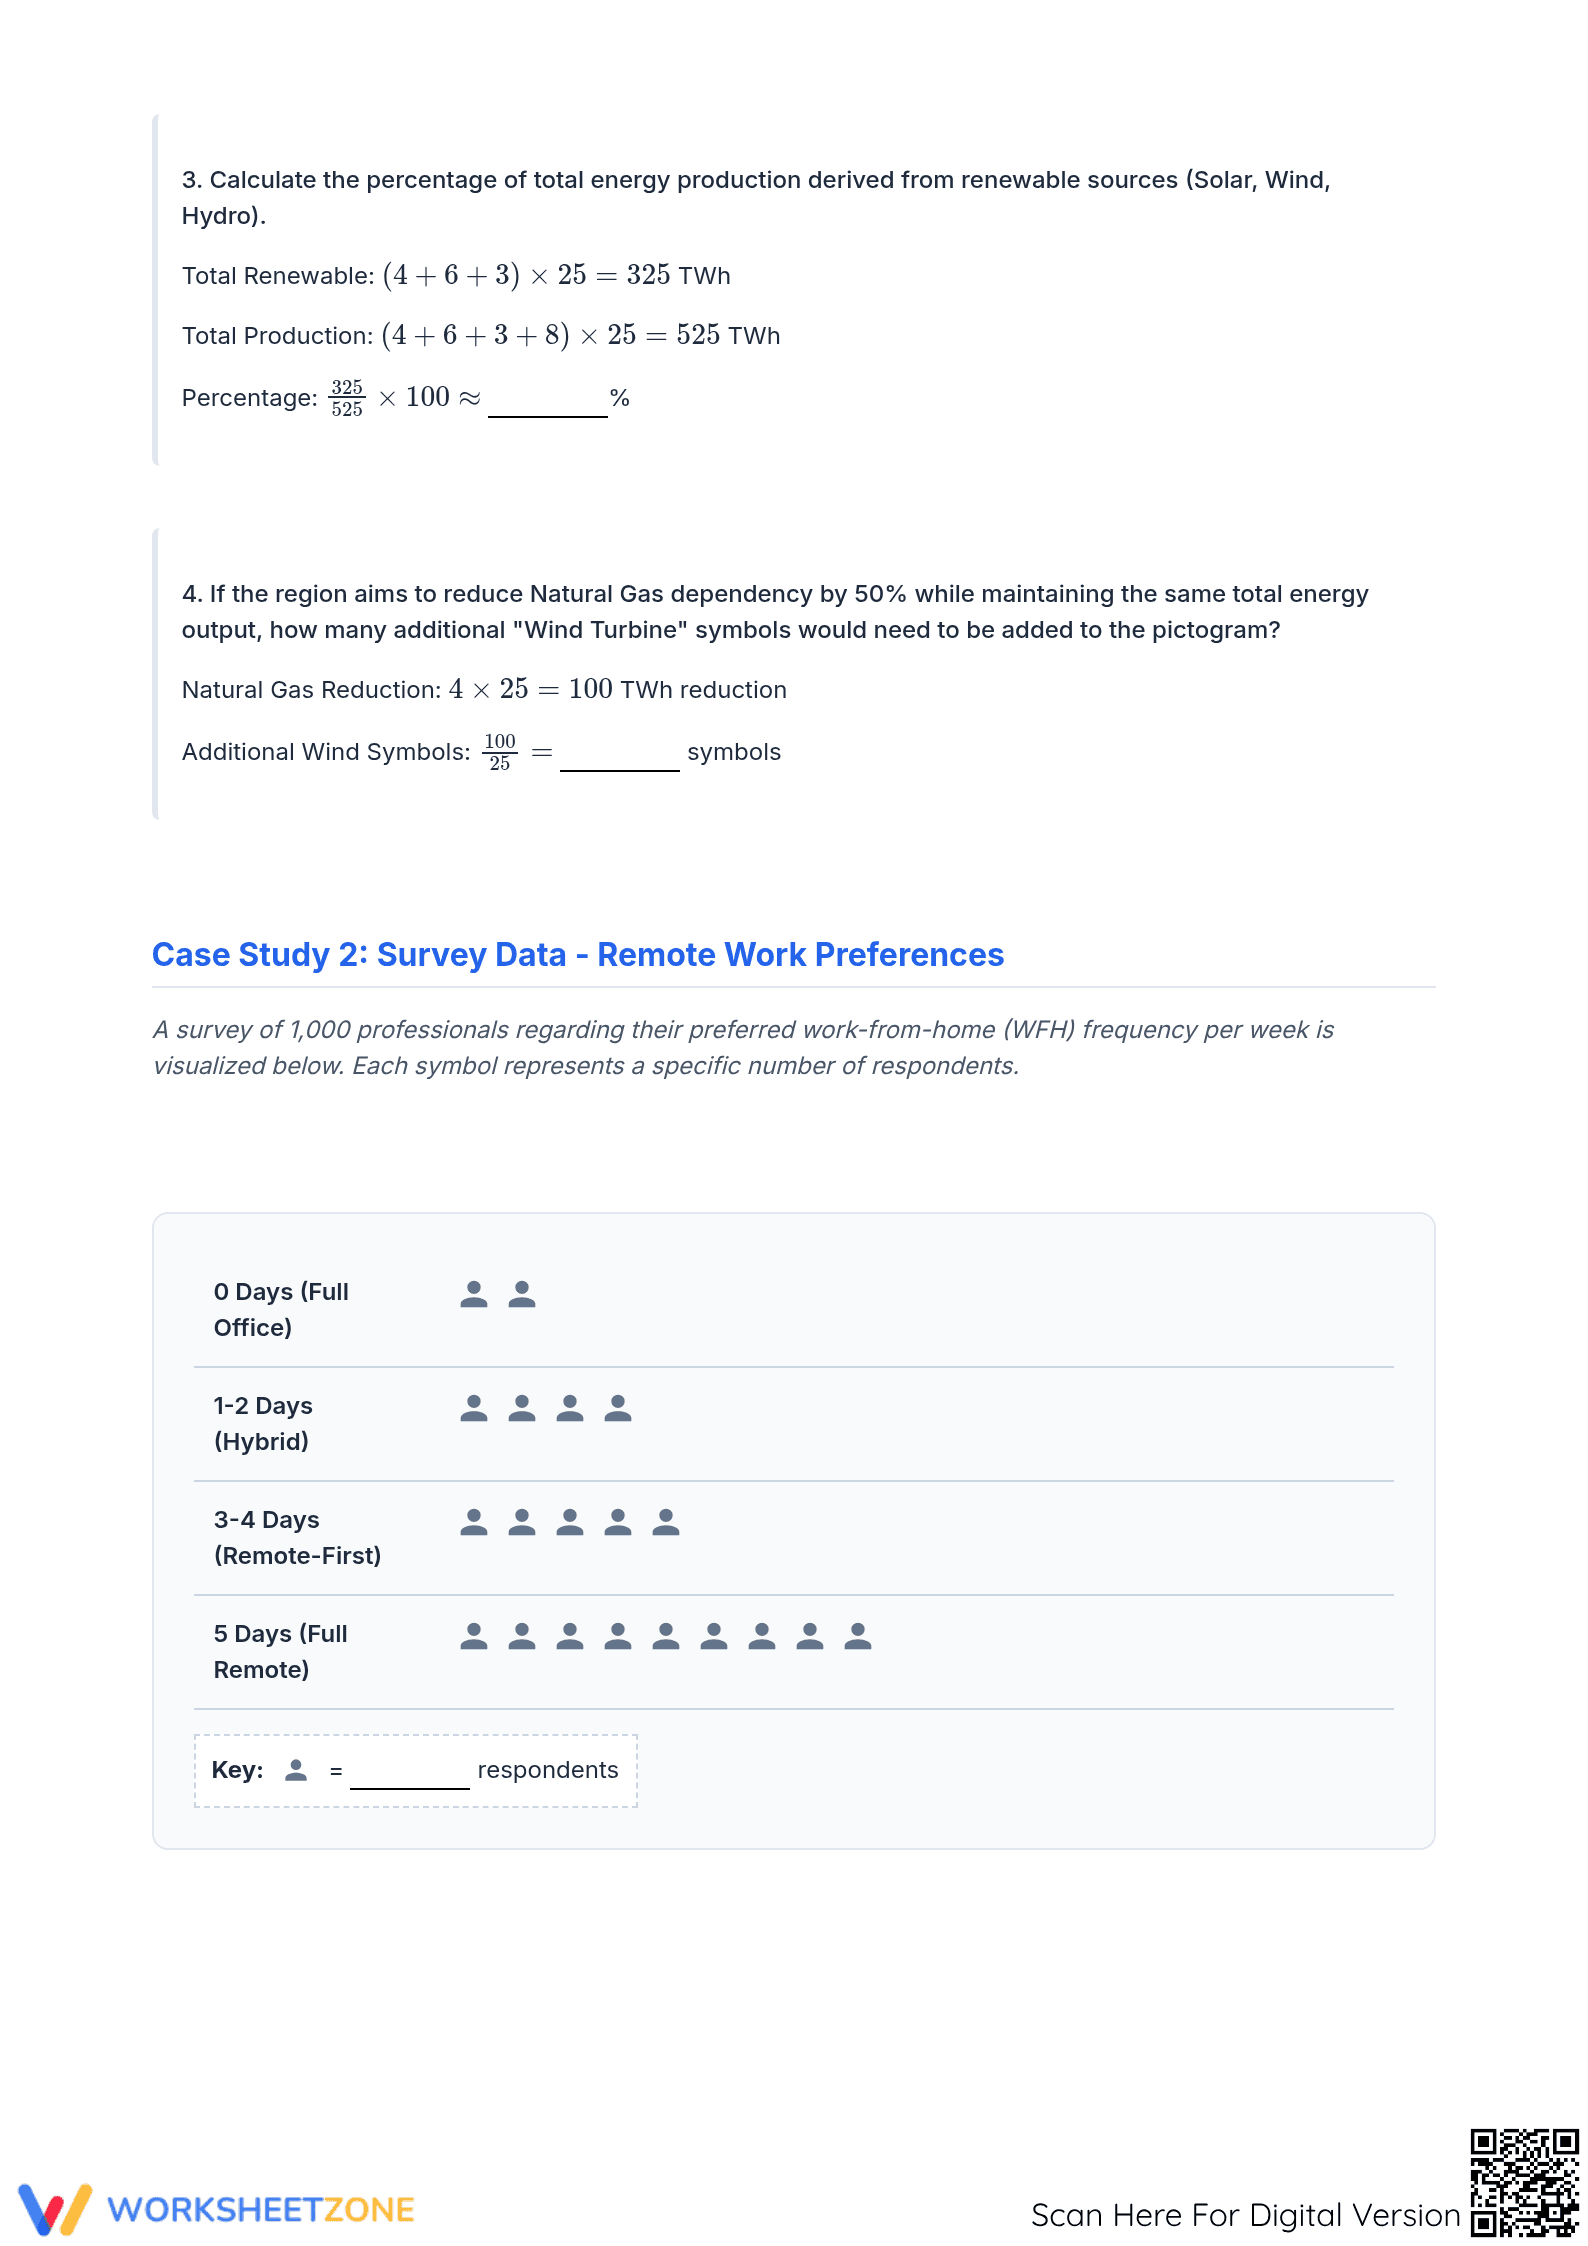
This advanced data interpretation worksheet empowers students to master complex pictograms through detailed case studies. Analyzing energy portfolios and survey data, learners calculate range, percentages, and central tendency. The resource bridges basic counting and sophisticated analysis, ensuring students translate visual representations into actionable numerical insights for college-level statistical literacy.
At a Glance
- Grade: College · Subject: Math
- Standard:
CCSS.MATH.CONTENT.HSS-ID.A.1— Represent data with plots on a real number line and interpret categorical data sets- Skill Focus: Advanced Pictogram Analysis
- Format: 3 pages · 8 problems · Answer key included · PDF
- Best For: Statistical literacy and functional skills practice
- Time: 25–35 minutes
The worksheet contains three comprehensive pages featuring two real-world case studies. Students encounter clear symbol keys and perform multi-step calculations including combined totals, ranges, and percentage derivations. The layout includes structured work boxes and a final extension question focused on the practical implications of data trends, such as real estate costs influenced by remote work.
Skill Progression
- Guided practice: The initial tasks provide calculation prompts to help students anchor symbol values and combined totals.
- Supported practice: Students progress to calculating ranges and renewable energy percentages using provided production totals.
- Independent practice: The final case study requires students to derive symbol values from a population of 1,000 and identify modes independently.
This worksheet follows a gradual-release model, moving from direct computation to higher-order statistical reasoning and real-world application.
Standards Alignment
Aligned to CCSS.MATH.CONTENT.HSS-ID.A.1, this resource requires students to interpret categorical data sets via pictograms. By calculating specific values and identifying trends, it also supports HSS-ID.A.2 by teaching learners to use statistics to compare centers and spreads within a distribution. Both standard codes can be copied directly into lesson plans, IEP goals, or district curriculum mapping tools to track student mastery of foundational data analysis concepts.
How to Use It
Assign this as a summative assessment or a rigorous collaborative activity. Teachers should observe students during Case Study 2 to verify they correctly derive the symbol value from the total respondent count. Most learners will complete the three-page set in 30 minutes, allowing for a follow-up discussion on the extension question. Use the formative-assessment moment to check for common errors in percentage calculations or mode identification.
Who It's For
This resource is designed for college-entry students or adult learners pursuing functional skills certifications. It is particularly effective for students who excel when data is tied to visual anchors and practical scenarios like energy consumption, rather than abstract numbers alone.
According to RAND AIRS 2024, the ability to decode non-linear data representations is a critical predictor of professional success. This worksheet addresses this need by requiring students to move beyond retrieval to synthesize information across multiple data points. By using CCSS.MATH.CONTENT.HSS-ID.A.1 as a framework, the tasks ensure that learners develop the statistical literacy required to navigate modern data-heavy environments. The inclusion of multi-step calculations aligns with the Fisher & Frey (2014) model of scaffolding, which emphasizes the transition from visual identification to conceptual mastery. Educators can rely on this tool to provide evidence-based practice in analyzing discrete data sets, ensuring students meet the rigorous demands of college-level quantitative reasoning. This approach transforms a standard math lesson into a functional skill-building session that prepares learners for complex real-world decision-making.