




























Views
Downloads



Essential Residuals Worksheet | Grade 12 Statistics

Paste this activity's link or code into your existing LMS (Google Classroom, Canvas, Teams, Schoology, Moodle, etc.).
Students can open and work on the activity right away, with no student login required.
You'll still be able to track student progress and results from your teacher account.
This Grade 12 statistics worksheet helps students master residual calculations and evaluate regression model fit. Working through structured computational tables and diagnostic plots, high school learners compute individual residuals, calculate error sums of squares, determine residual standard deviation, and assess bivariate model adequacy.
At a Glance
- Grade: 12 · Subject: Statistics
- Standard:
HSS-ID.B.6— Calculate residuals and assess model fit using plots and error summaries- Skill Focus: Calculate Residuals and Summaries
- Format: 5 pages · 12 problems · Answer key included · PDF
- Best For: Regression review and model diagnostics practice
- Time: 45–60 minutes
What's Inside
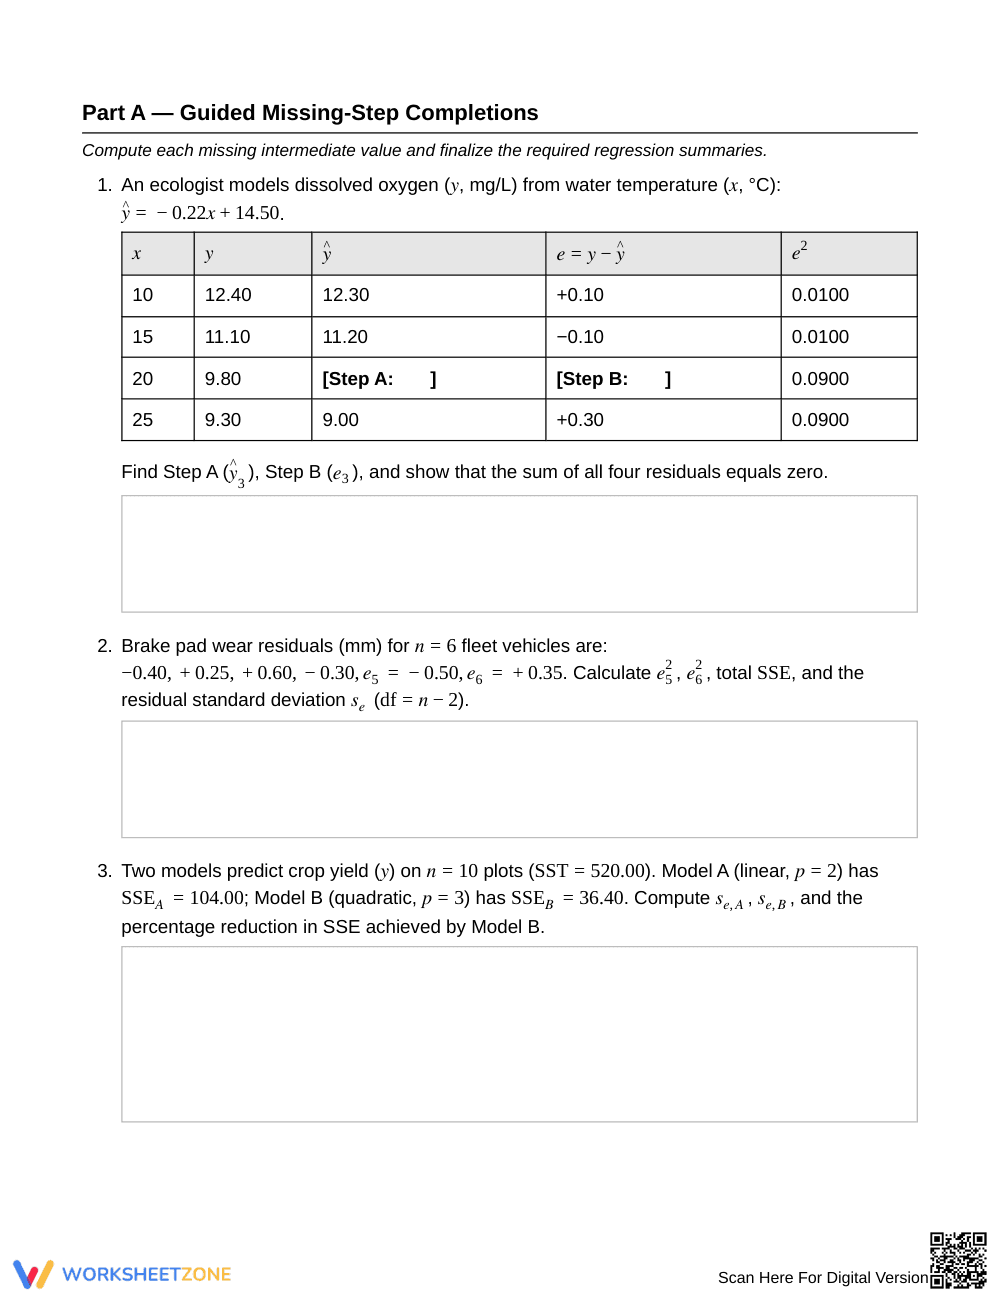
The 5-page resource includes a core formula box, two worked examples, and 12 analytical tasks. Students complete structured data tables with missing steps, calculate SSE and residual standard deviation across practical contexts, and interpret residual plots. A 2-page answer key provides step-by-step arithmetic and diagnostic explanations.
Skill Progression
- Guided Practice (Part A, Problems 1–4): Scaffolded completion tasks prompting students to calculate missing residuals, verify zero-sum properties, find SSE, and compute residual standard error with given regression equations.
- Supported Practice (Part B, Problems 5–8): Semi-structured contextual problems requiring learners to build calculation tables from raw coordinates, interpret standard error, and identify pattern violations on residual plots.
- Independent Practice (Part B & Part C, Problems 9–12): Autonomous tasks addressing outlier effects, multi-model comparisons, and statistical assumptions regarding constant error variance.
This sequence follows a gradual-release model, transitioning students from formula practice to independent evaluation.
Standards Alignment
This worksheet aligns with primary standard `HSS-ID.B.6`: Represent data on two quantitative variables on a scatter plot, and describe how the variables are related. Supporting standard `HSS-ID.B.6a` emphasizes fitting functions and analyzing residuals to assess model appropriateness. Both standard codes can be copied directly into lesson plans, IEP goals, or district curriculum mapping tools.
How to Use It
Assign this worksheet following direct instruction on regression lines and residual definitions. For formative assessment, examine student work on Part A, Problem 1 to verify that students subtract predicted values from observed values rather than reversing the terms. The 12 problems take 45 to 60 minutes during class or collaborative practice.
Who It's For
Designed for Grade 12 Statistics students, this resource builds quantitative precision for AP preparation or general statistics coursework. Teachers can provide the formula box for targeted accommodation or challenge learners to compare model complexities. Pair this worksheet with a scatterplot graphing calculator investigation for comprehensive instruction.
According to Fisher & Frey (2014), purposeful gradual-release instructional frameworks enable high school mathematics students to move effectively from mechanical procedural computation to rigorous conceptual analysis. When addressing standard HSS-ID.B.6, statistics students frequently calculate individual deviations accurately but struggle to interpret what residual standard deviation communicates about real-world model reliability. This structured 12-task worksheet directly targets that documented cognitive barrier by combining tabular computations with visual diagnostic plot evaluation. Students calculate individual error values, verify that residual sums equal zero in least-squares models, determine residual standard deviation across multiple models, and identify visual violations of constant error variance. By applying these statistical diagnostics across authentic engineering, ecological, and clinical scenarios, the resource provides the deliberate structured scaffolding recommended by Fisher & Frey (2014) to build lasting conceptual mastery in advanced secondary statistics classrooms. Secondary educators can utilize these guided materials to strengthen student reasoning with quantitative relationships.


