




























Views
Downloads
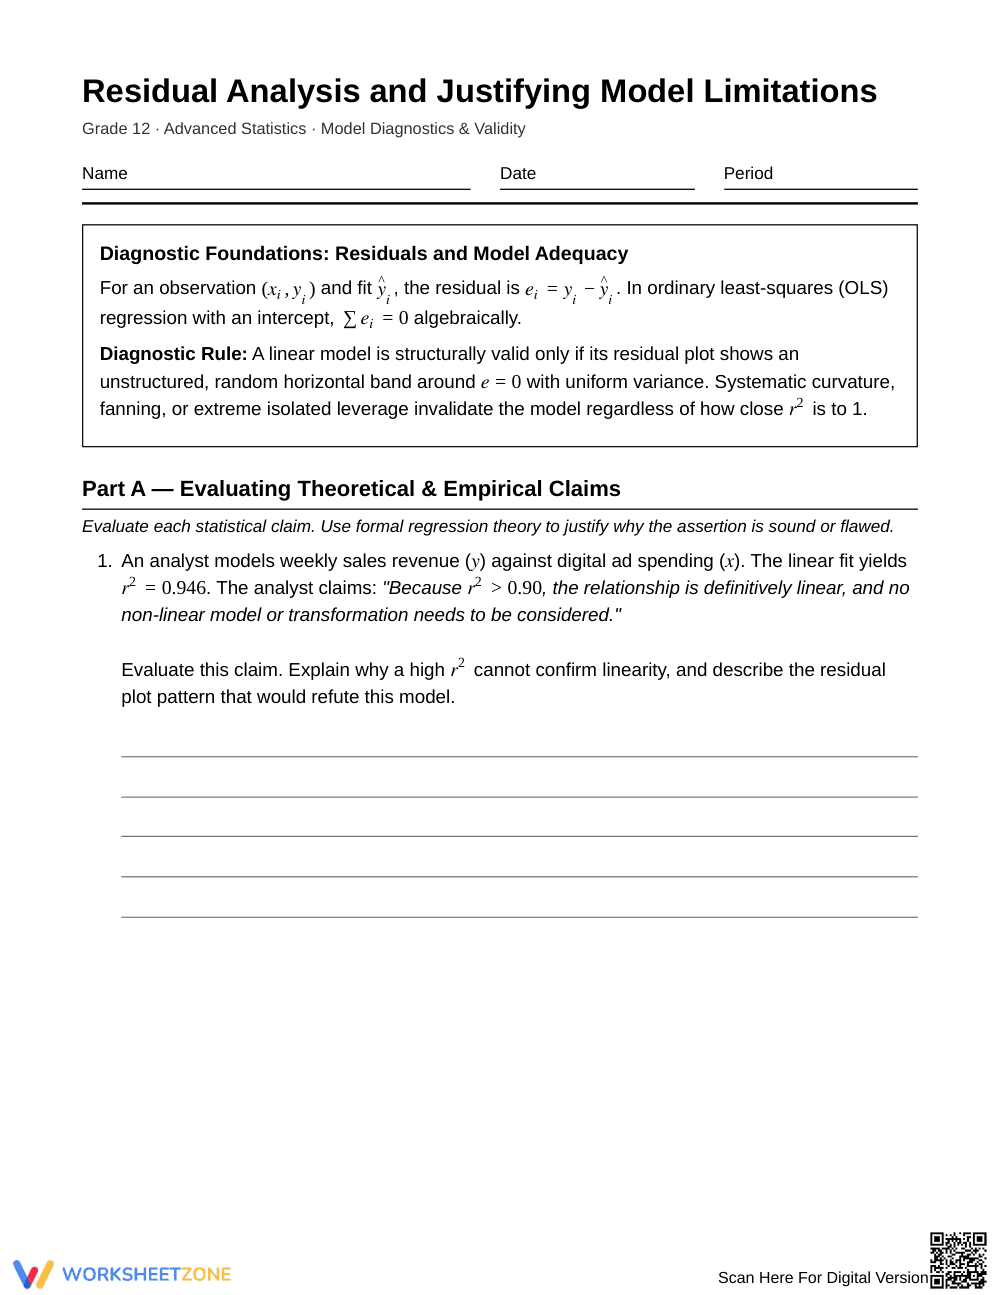

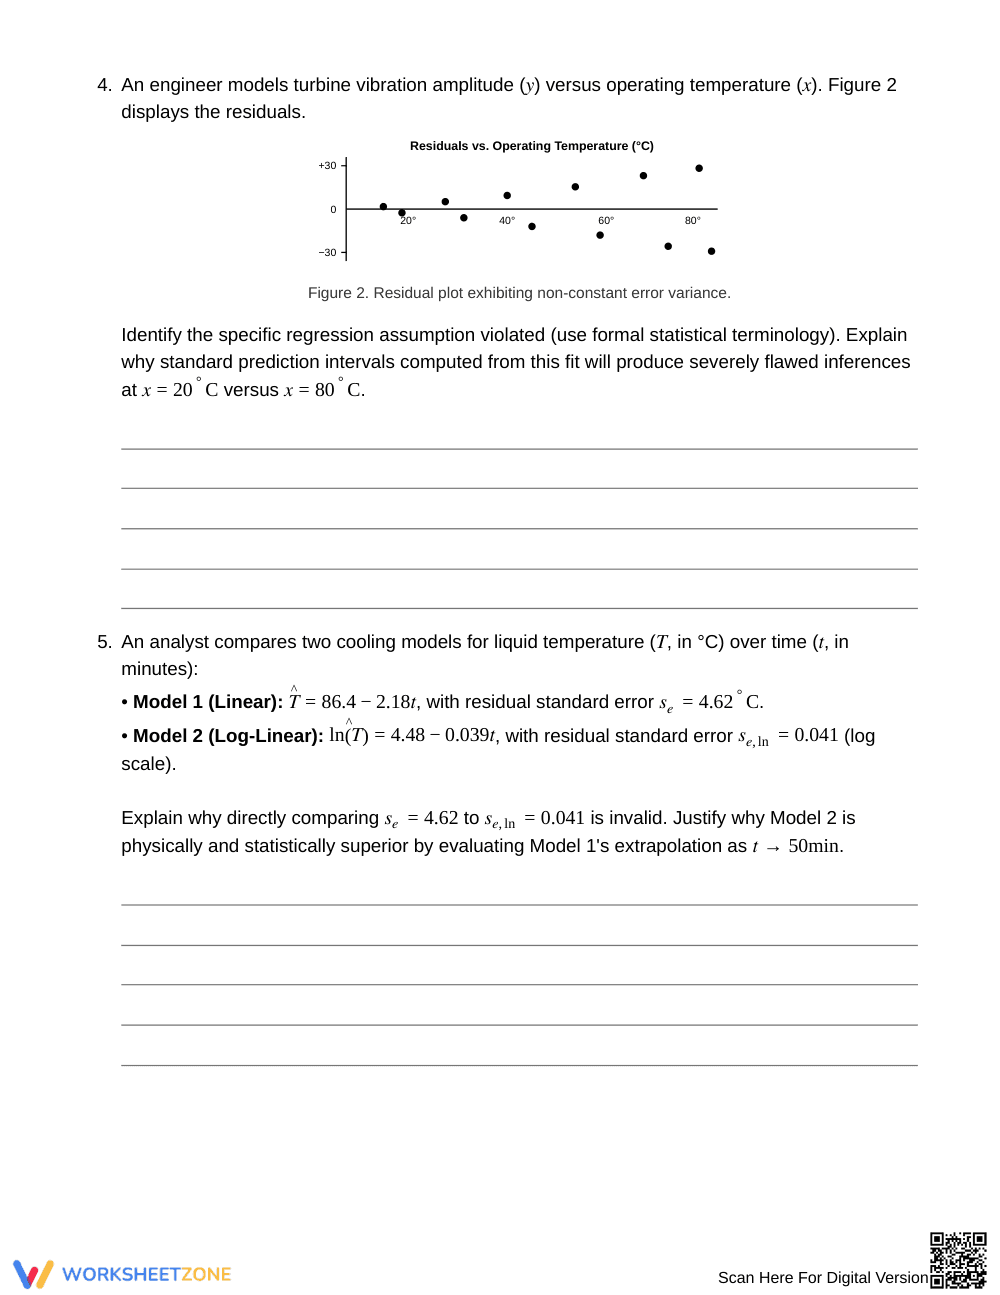
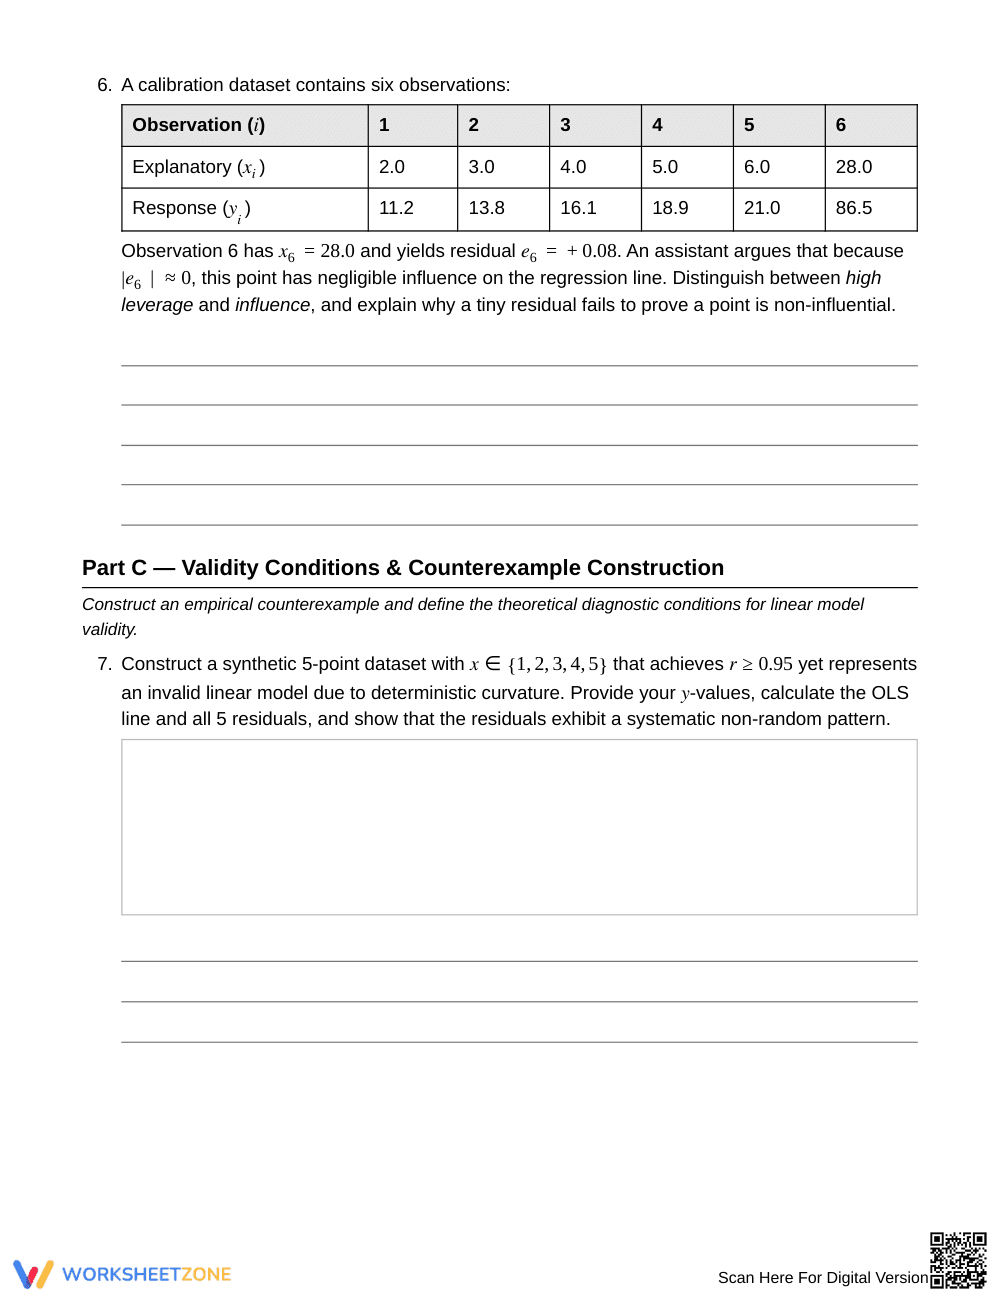
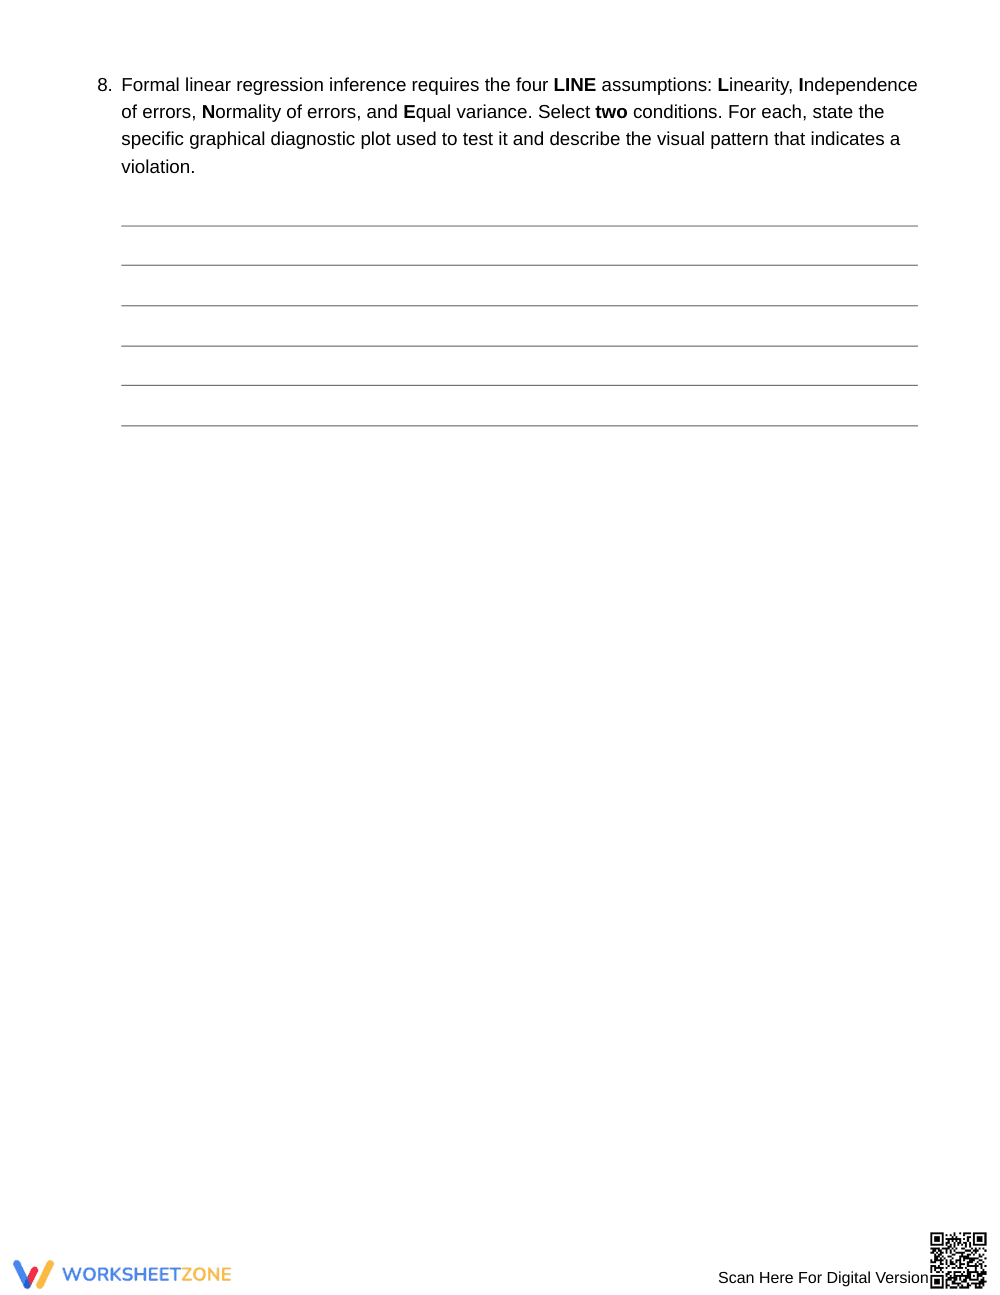

Essential Model Limitation Worksheet | Grade 12 Statistics

Paste this activity's link or code into your existing LMS (Google Classroom, Canvas, Teams, Schoology, Moodle, etc.).
Students can open and work on the activity right away, with no student login required.
You'll still be able to track student progress and results from your teacher account.
This advanced statistics worksheet equips high school seniors to evaluate regression validity and rigorously justify model limitations. Across eight diagnostic items, students analyze residual plots, distinguish leverage from influence, and evaluate non-linear alternatives to prevent common empirical modeling errors in bivariate data analysis.
At a Glance
- Grade: 12 · Subject: Statistics
- Standard:
HSS-ID.B.6— Evaluate bivariate model fit and residual plots to justify model limitations- Skill Focus: Justify a Model Limitation
- Format: 5 pages · 8 problems · Answer key included · PDF
- Best For: AP Statistics model diagnostic review and assessment
- Time: 45–60 minutes
This 5-page practice set delivers 8 analytical tasks supported by a diagnostic rule box, bivariate data tables, and residual scatter plots. Students evaluate assertions regarding r-squared, compare linear and transformed models, and construct mathematical counterexamples. A 3-page answer key provides complete algebraic proofs and diagnostic explanations for all problems.
Skill Progression
- Guided practice (Part A, 2 items): Students evaluate claims about r-squared and zero-residual sums using diagnostic rule support.
- Supported practice (Part B, 4 items): Students interpret residual plots for heteroscedasticity, compare transformed fits, and evaluate high-leverage points.
- Independent practice (Part C, 2 items): Students construct 5-point counterexample datasets and define tests for regression LINE assumptions.
This sequence follows a gradual-release model transitioning students from diagnostic evaluation to autonomous counterexample construction.
Standards Alignment
This resource aligns with standard HSS-ID.B.6: Represent data on two quantitative variables on a scatter plot, and describe how variables are related. It specifically supports HSS-ID.B.6.B by prompting students to assess function fit using residuals. Both standard codes can be copied directly into lesson plans, IEP goals, or district curriculum mapping tools.
How to Use It
Deploy this worksheet after direct instruction on regression diagnostics as an analytical problem-solving session or AP Statistics review task. During work time, check whether students mistakenly equate a high r-squared value with verified linearity on Part A. Students typically complete the 8 tasks in 45 to 60 minutes.
Who It's For
Designed for Grade 12 AP Statistics and introductory college data science students. Differentiate by providing residual calculation tables for students needing computational support while tasking advanced learners with deriving formal leverage values. Pair this resource with an interactive scatter plot graphing lesson.
According to findings highlighted in the RAND AIRS 2024 educational review, upper-secondary mathematics students demonstrate significantly deeper conceptual mastery of statistical inference when curriculum materials require them to construct counterexamples and evaluate graphical residual patterns rather than relying solely on procedural computation. Mastery of standard HSS-ID.B.6 requires learners to look beyond summary metrics like the correlation coefficient and actively justify regression model limitations through diagnostic reasoning. By directly confronting common empirical pitfalls—such as conflating high leverage with influence, overlooking non-constant variance, or uncritically accepting a high r-squared value on non-linear data—students build authentic diagnostic competence. Structured diagnostic practice allows high school seniors to transition successfully from formula execution to critical scientific evaluation. This five-page instructional resource delivers eight targeted analytical problems that anchor student learning in rigorous model evaluation, establishing essential foundations for collegiate coursework in statistics, econometric modeling, and quantitative empirical research.


