


1 / 3
0
Views
0
Downloads


0.0
0
Save
0 Likes
Dot Plot Exercise Worksheet for Data Analysis
0 Views
0 Downloads
Paste this activity's link or code into your existing LMS (Google Classroom, Canvas, Teams, Schoology, Moodle, etc.).
Students can open and work on the activity right away, with no student login required.
You'll still be able to track student progress and results from your teacher account.
Information
Description
What It Is:
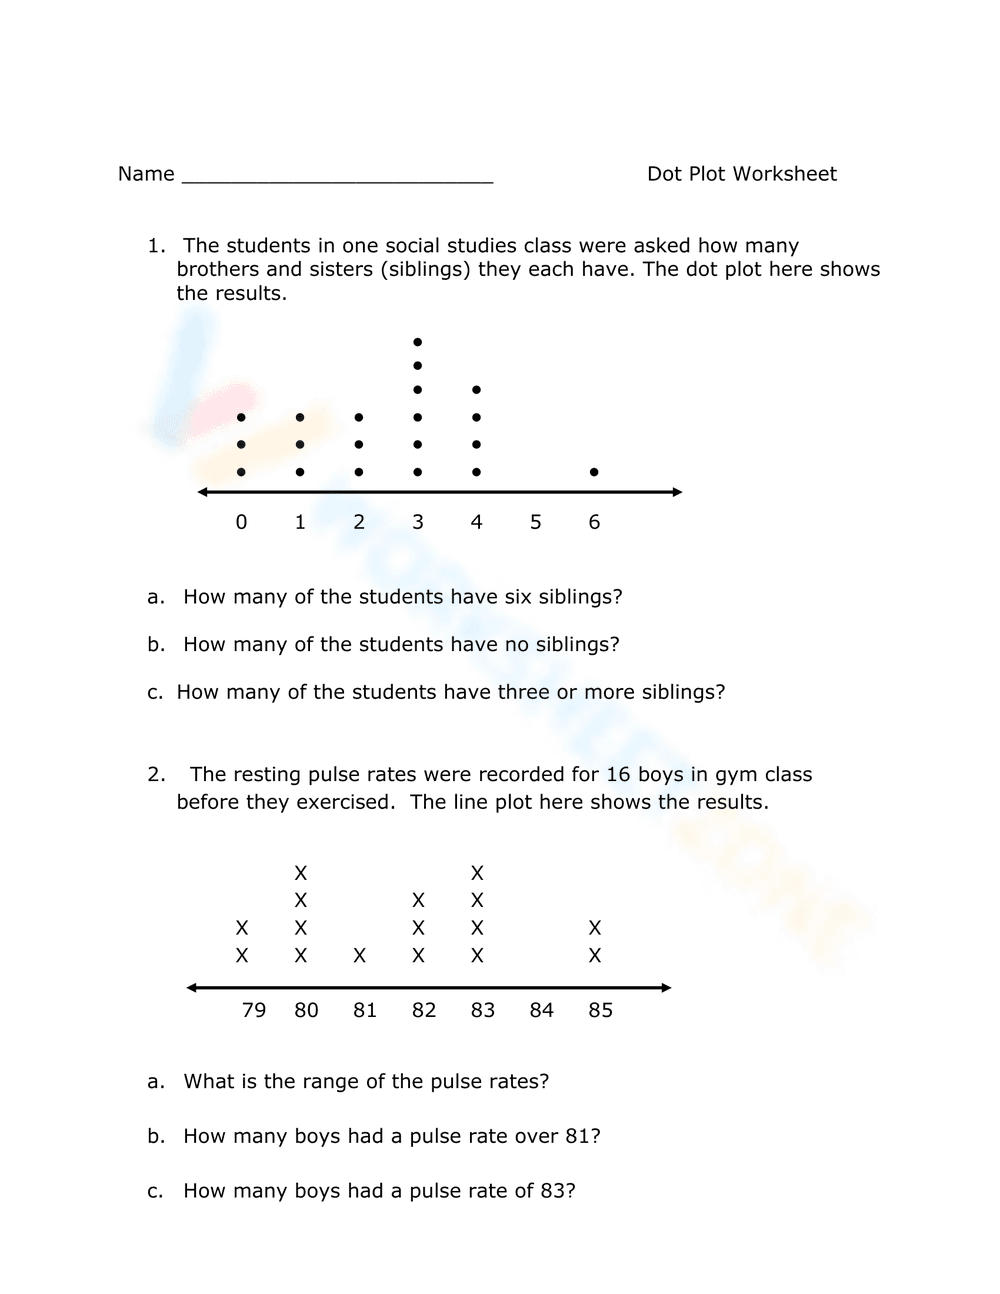
This is a dot plot worksheet with two exercises. The first exercise presents a dot plot showing the number of siblings students in a social studies class have. Students answer questions based on the dot plot, such as how many students have six siblings or no siblings. The second exercise shows a line plot of the resting pulse rates of 16 boys in gym class. Students answer questions about the range of pulse rates and how many boys had certain pulse rates.
Grade Level Suitability:
This worksheet is suitable for grades 4-6. It involves reading and interpreting data presented in dot plots and line plots, which are skills typically taught in these grades. The questions require basic arithmetic and data analysis.
Why Use It:
This worksheet helps students develop skills in data interpretation, reading dot plots and line plots, and answering questions based on visual data. It reinforces the understanding of range and data frequency. It also provides real-world contexts (siblings, pulse rates) to make the learning more engaging.
How to Use It:
Students should first read the scenario presented in each exercise. Then, they should carefully examine the dot plot or line plot to understand the data representation. Finally, they should answer the questions by analyzing the data presented in the plot.
Target Users:
This worksheet is ideal for elementary and middle school students learning about data analysis and representation. It can be used in math class, science class, or any subject where data interpretation is required. It's also useful for students who need extra practice with dot plots and line plots.