


























Views
Downloads
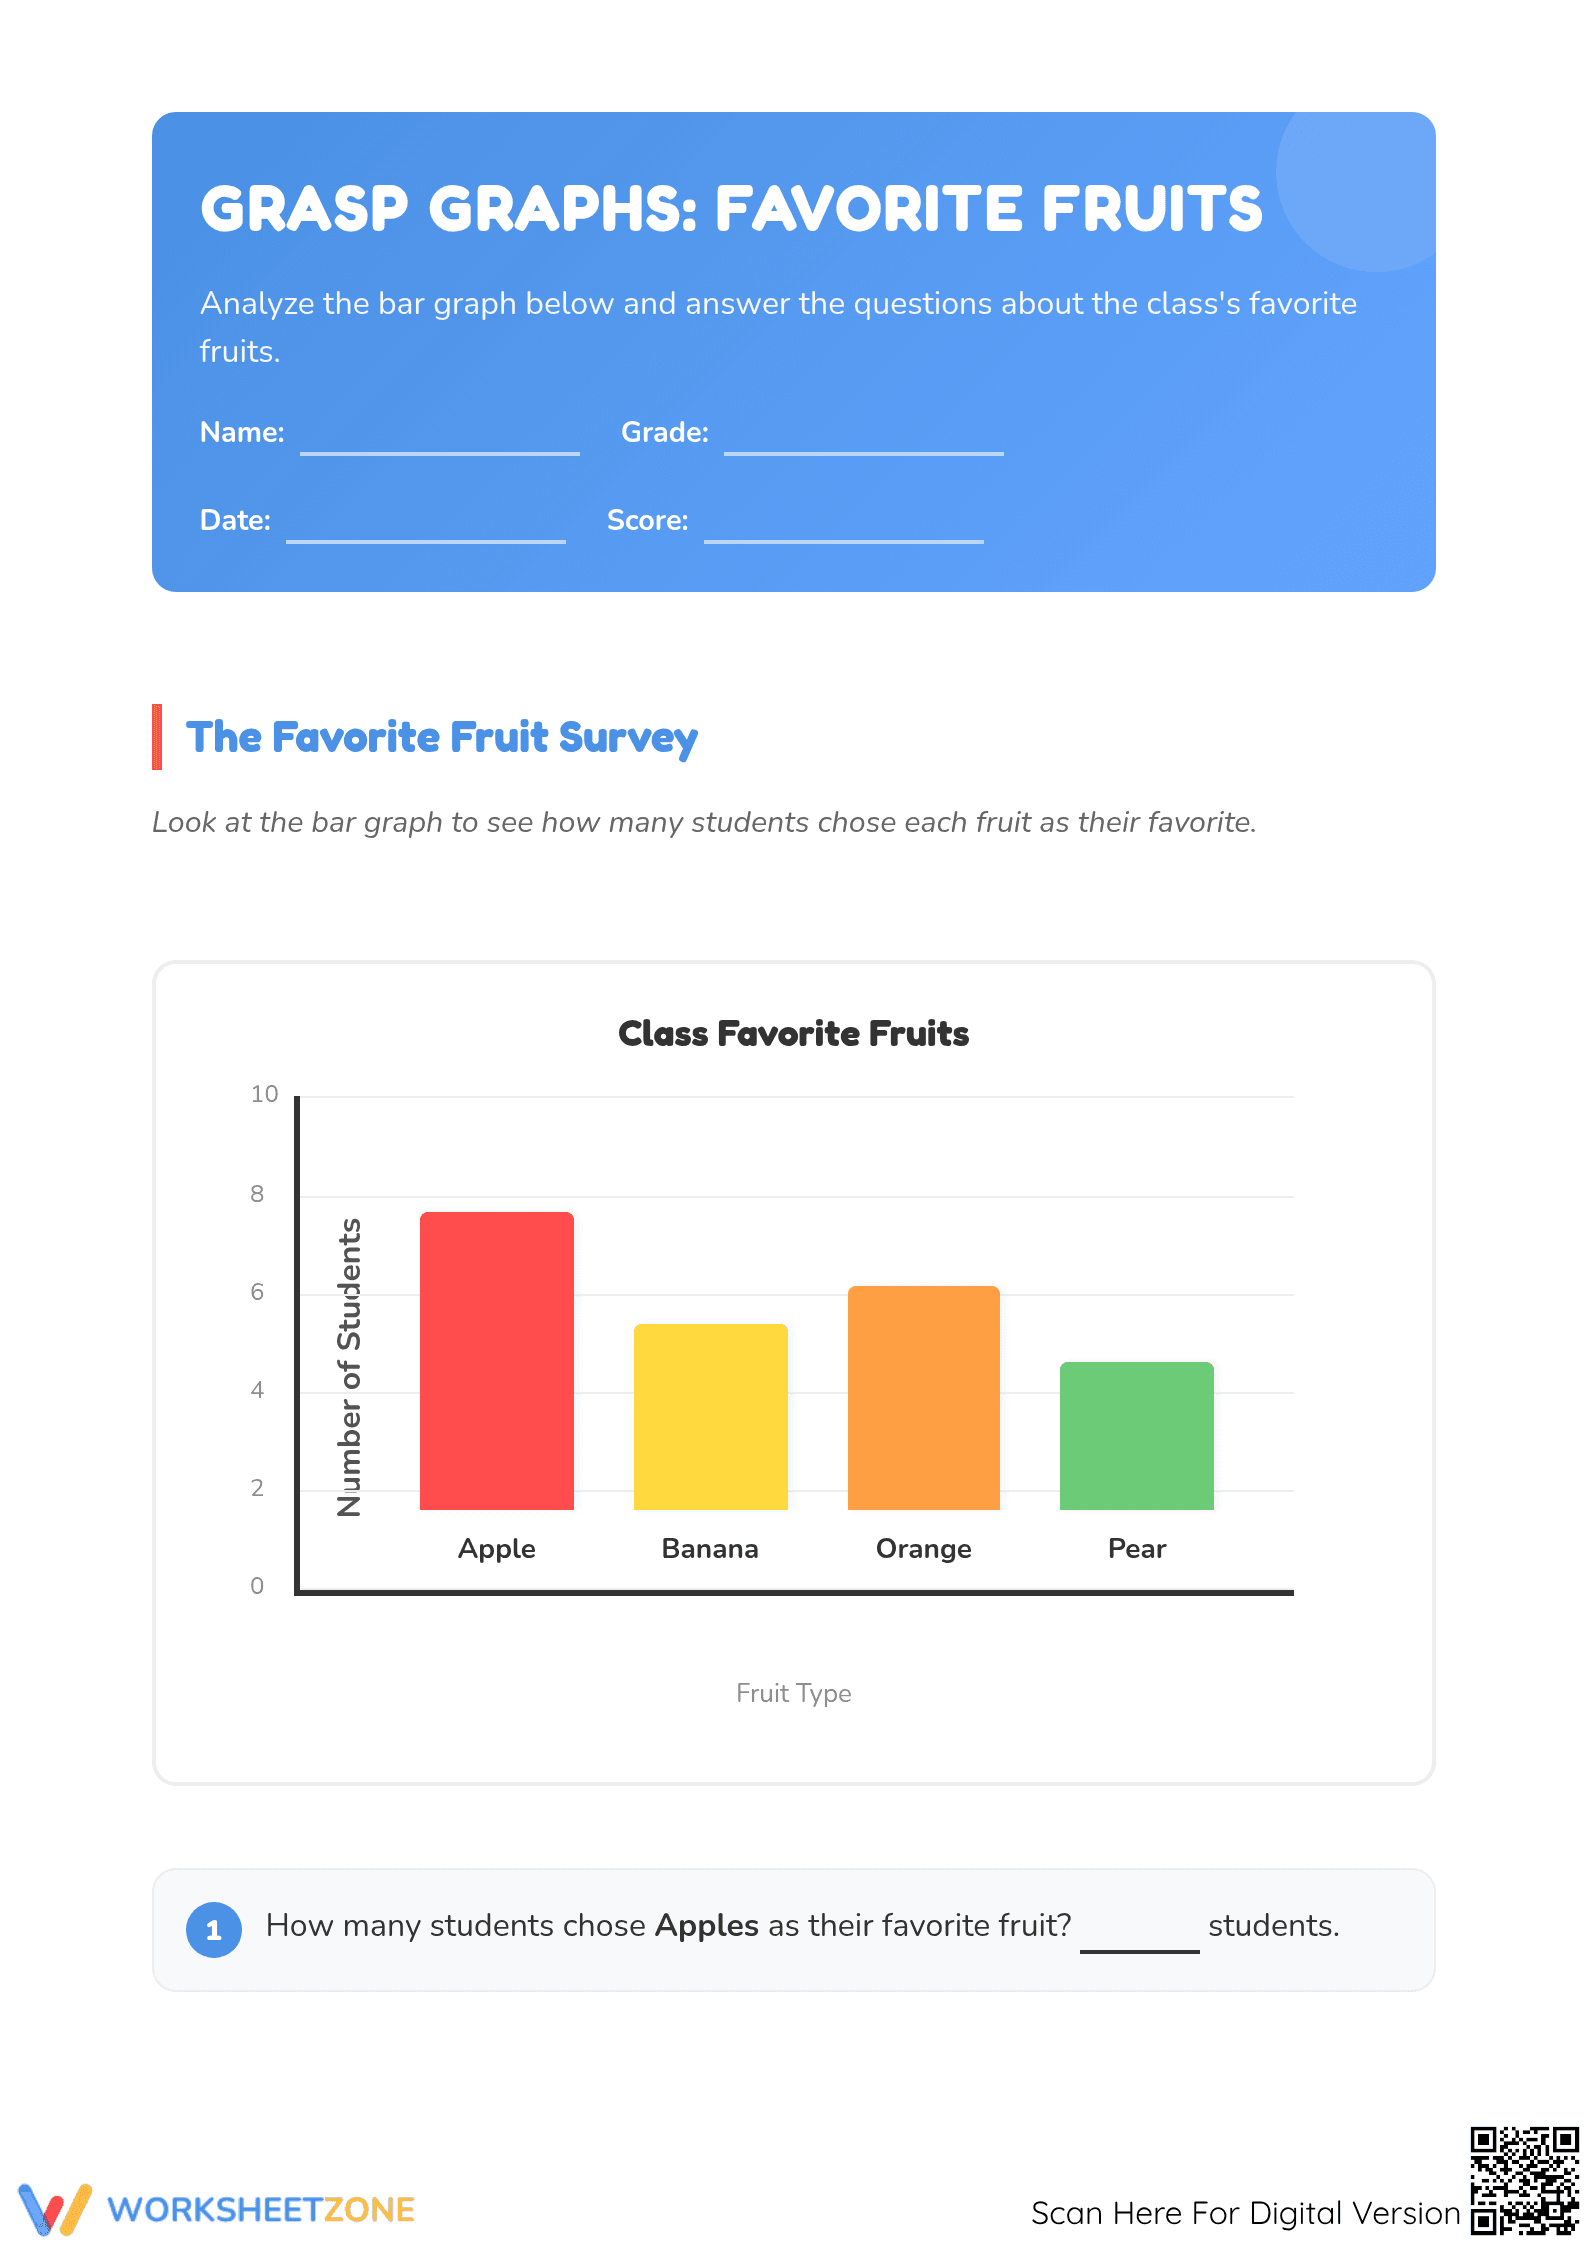


Essential Bar Graph Practice Worksheet | Grade 2 Math
Paste this activity's link or code into your existing LMS (Google Classroom, Canvas, Teams, Schoology, Moodle, etc.).
Students can open and work on the activity right away, with no student login required.
You'll still be able to track student progress and results from your teacher account.
Master the essentials of data representation with this focused graphing review. Students practice interpreting a "Favorite Fruit" bar graph, extracting specific values, and performing comparative calculations to solve 9 realistic problems. By engaging with these visual data sets, learners build the critical analytical skills required for higher-level mathematical reasoning and evidence-based conclusion drawing.
At a Glance
- Grade: 2 · Subject: Math
- Standard:
2.MD.D.10— Solve simple put-together, take-apart, and compare problems using bar graph information- Skill Focus: Data analysis and comparative graphing
- Format: 2 pages · 9 problems · Answer key included · PDF
- Best For: Independent practice or formative assessment
- Time: 15–20 minutes
This two-page PDF resource includes a clearly labeled bar graph followed by nine multi-step questions. The first section focuses on direct data extraction and basic identification, while the "Dig Deeper" section challenges students with addition, subtraction, and hypothetical data scenarios. A full answer key is provided for immediate feedback and grading efficiency.
Skill Progression
- Guided Data Extraction: Five initial questions provide scaffolded practice in identifying specific bar heights and identifying data extremes like most and least popular categories.
- Calculated Comparisons: Middle-tier tasks require students to determine differences between categories and calculate the total data set population using the graph.
- Critical Analysis: Final problems involve "what if" hypothetical adjustments and true/false verification to ensure students truly understand the data relationships.
This gradual-release structure ensures students build confidence before tackling complex comparative tasks following the I Do, We Do, You Do model.
Standards Alignment: Primary standard 2.MD.D.10 — Draw a picture graph and a bar graph (with single-unit scale) to represent a data set with up to four categories. Solve simple put-together, take-apart, and compare problems using information presented in a bar graph. Both standard codes can be copied directly into lesson plans, IEP goals, or district curriculum mapping tools.
How to Use It: Use this worksheet as a formative assessment after introducing bar graphs to gauge student mastery of data reading. It also works excellently as an independent practice station during math rotations. Observe if students are using their fingers to track bar heights to the Y-axis; this identifies a need for additional visual tracking scaffolds. Expected completion time is 15 to 20 minutes.
Who It's For: This resource is designed for Grade 2 students but serves as an excellent remedial tool for Grade 3 learners needing a refresher on comparative data. It pairs naturally with direct instruction on Y-axis scales and can be used alongside concrete manipulatives like linking cubes to represent graph bars physically during the instructional phase.
According to the RAND AIRS 2024 report, structured exposure to varied data representation formats is a primary driver of mathematical literacy in early elementary education. This worksheet directly addresses the need for student-facing materials that bridge the gap between simple data identification and complex multi-step reasoning. By requiring students to calculate "more than" differences and total sums based on a visual prompt, the activities reinforce the connection between visual data and numerical operations. Research from NAEP indicates that students who can fluidly translate information between different mathematical representations—such as graphs to numbers—show significantly higher achievement in problem-solving domains. This resource provides the repetitive, focused practice necessary to solidify these translation skills, ensuring learners can move beyond superficial reading to deep analytical understanding of information presented in 2.MD.D.10 aligned materials. The inclusion of hypothetical data changes further encourages higher-order thinking beyond static recall.


