


In this lesson, students will learn how to identify congruent and similar figures. They will base their conclusions on the relationship between corresponding parts in pairs and sets of figures. Students will apply the concept of scale factor to the changes in figures when they are reduced and enlarged. Students will:
- identify congruent and similar polygons.
- explain what characteristics determine similarity and congruence.
- determine the relationship between the scale factor, perimeter, and area.
- graph figures with their images (congruent, similar, and non-similar).
- write and apply rules for reducing and enlarging figures, such as (x, y) → (2x, 2y).
- consider the congruence and similarity of circles.
- use congruence and similarity concepts to solve problems involving missing values.
- apply the concept of scale factor to drawings and maps.
- How can we use the relationship between area and volume to draw, construct, model, and represent real scenarios, and/or solve problems of area and volume?
- Congruent: Having the same shape and size.
- Corresponding: Parts of a figure, such as sides and angles, which are in the same relative position in two different figures.
- Similar: Having the same shape, but a different size which is proportional to another figure.
- Scale Factor: The ratio of the lengths of the corresponding sides in similar figures, the number multiplied by the side length measures of one figure to create a reduced or enlarged image.
- student copies of Vocabulary Journal pages (M-7-6_Vocabulary Journal)
- ¼ inch or centimeter grid paper
- shape sets (M-7-6-3_Shape Set), cut apart and place each set in an envelope or zipper bag, one set for each group of 2–4 students
- student copies of the Shape Set Record sheet (M-7-6-3_Shape Set Record Sheet), one record sheet per group or per student
- one copy or transparency of the Shape Set sample responses (M-7-6-3_Shape Set Sample Record)
- student copies of the Scale Factor and Similarity Labsheet and one copy or transparency of the answer key (M-7-6-3_Scale Factor Labsheet and KEY)
- student copies of the Similarity Applications sheet, and 1 copy or transparency of the answer key (M-7-6-3_Similarity Applications)
- 18 x 24 inch drawing paper or poster paper, 1 for each pair or small group
- markers or colored pencils for group use
- rulers, centimeter/inch
- optional: chart paper with grids for demonstration purposes
- a variety of road maps, U.S. geography maps, or local city maps (could be printed from Internet sources, pages from an old atlas, folded road maps)
- student copies of the Exit Ticket for Lesson 3 (M-7-6-3_Exit Ticket Lesson 3 and KEY)
- student copies of the Rethinking Congruence and Similarity page (M-7-6-3_Rethinking Similarity and KEY)
- student copies of the Size 6 Grid (M-7-6-3_Grid Size 6)
- student copies of Morph Your Character record tables (M-7-6-3_Morph Your Character)
- additional similarity exercises, if needed (M-7-6-3_More Work with Similarity)
- Informally assess student comprehension by observing during class discussions about shape set comparisons, discovering congruence and similarity, and map reading.
- Formally assess students using the Scale Factor graphing activity, Similarity Applications activity, and related presentations.
- At the end of the lesson, use an Exit Ticket to formally evaluate student understanding.
W: The class is provided with a question about similar figures with one missing value or a map question involving scale. Students consider how to solve it. Whether or not the class works out how to solve it, they learn that this lesson leads to other similar problems and ways to solve them.
H: Student groups start by comparing a set of figures. They express their observations about shape, size, corresponding sides, and angles. This activity leads to a discussion about congruence and similarity.
E: Students recognize congruence and similarity based on the characteristics of the corresponding parts, such as ratios. The activities progress to calculating the scale factor. The scale factor is used to graph and solve problems involving similar figures. Students use similarity and scale factor concepts to a variety of examples, including missing values with similar figures, shadow problems, mirror reflections, embedded triangles, road map reading, and scale drawing problems.
R: Student groups are encouraged to change their solutions as necessary during work and class discussions. You and student peers ask questions to help partners and presenters identify inaccuracies in their thinking and correct them.
E: Observation is essential as the lesson progresses. The Similar Figure Graphs, Enlargement activity, and Exit Ticket all help to assess student comprehension, progress, and proficiency.
T: Use extension recommendations to personalize the lesson to students' needs. The small group activity is appropriate for the entire class or students who require further instruction or practice. An Extension activity is designed for students who have demonstrated proficiency and are ready for a challenge. There is a project suggestion for the whole class. This can be tailored to deliver more difficult parts to students who are ready and less difficult parts to students who need more practice, allowing everyone to participate successfully. Additional activities are provided for classroom review and technology use.
O: The lesson begins with a similarity problem to encourage students to consider how figures are related and how the relationships between them may be useful in life. Students begin comparing figures to identify similarities and differences in shape and size using the Shape Set and Shape Set Record. The lesson leads to an examination of the specific characteristics of congruent and similar figures. Students learn strategies for working with similar figures, such as determining similarity, comparing measures of corresponding angles, calculating ratios of corresponding side lengths, and determining scale factors for reducing and enlarging figures. The Scale Factor Labsheet encourages students to graph similar figures and make additional comparisons. All of these strategies lead to practice in solving problems involving missing values in similar figures, comparing the relationship between scale factor, perimeter, and area of similar figures, creating similar triangles using shadows and mirror reflections, understanding the scale used in scale drawings, and using a scale on a map. The lesson ends with a Similarity Application activity and an Exit Ticket. Throughout the lesson, a range of visual and hands-on strategies are utilized to appeal to different learning styles while also assisting students in organizing and solidifying a large number of concepts in a short amount of time. Several Extension activities are offered to provide additional practice opportunities and to broaden the learning in the lesson.
Before the lesson, prepare one shape set for each small group (M-7-6-3_Shape Set). Cut out the shapes and place each set in a zipper bag or envelope. Set these aside.
When students come, post one or two example questions on the board. One example could be a drawing of large and little comparable polygons. The figures could be large paper cutouts or simple drawings on the board. Label the corresponding sides.
Ask students how they would go about finding the perimeter or at least one missing side. If you want to use a second example, it could be a map, a school floor plan, or a scale drawing. Ask students if they can figure out how to determine the size of a specific object on a drawing or in real life. Do not ask students to solve the problems. Rather, ask them to explain their ideas on how it could be solved.
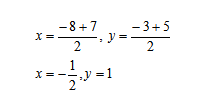
Possible example 1:
Allow students to consider the methods required to find an answer to the question(s) you selected. Invite several students to share their ideas. Emphasize correct logic, and use guiding questions to adjust incorrect logic.
"You've probably observed that the majority of our responses focused on the shape and size of our figures. Sometimes it can be difficult to compare two or more objects or situations when you don't know what to call each part. Labeling the vertex points would allow us to easily compare the star figures. We can use any variables (letters) that we want. I'll use q, r, s, t, and u in the first figure." Go to the board and label the figure.
"The second figure will usually include labels with completely different letters, such as b, c, d, e, and f. If the shapes are similar, the second figure may have the same letters as the first, but with the prime symbol on each of them to show that the second figure is an image of the first. In our case, they would be q', r', s', t', and u'. If prime symbols are used, the letters must be put in the same relative location on both figures and be placed in the same order going around the figures." Display on the second star figure.
"These labels are used to compare the same parts of the two figures. This means when comparing the center top angle of two figures, we say 'angle q corresponds to angle q¢.' Similarly, we may compare the corresponding sides. Segment (side) qr corresponds to segment (side) q'r', and so on." Ask students several questions about identifying other corresponding in this or additional examples to be sure they understand the correspondence concept before moving on.
"In this lesson, we will examine several strategies for comparing figures and solving problems such as the star problem. We can also solve a variety of practical problems requiring graphs, floor plans, scale drawings, and maps."
Discovering Congruence and Similarity Activity
"I would like you to get into groups [of 2-4] for our first activity." As students get into groups, provide one shape set envelope and one record sheet to each group (M-7-6-3_Shape Set and M-7-6-3_Shape Set Record Sheet).
"Each group has received a shape set and a record sheet. I want you to find the different pairs of shapes indicated on your record sheet and arrange them together. You will be comparing these pairs of figures. As a group, you will examine one pair at a time. Brainstorm as many ideas as possible on how the figures compare. Consider how all of the corresponding parts compare. In the available space, write a specific comparison statement using the corresponding sides and angles. Repeat these steps until you've compared all of the pairs." Move around the room, listening to and guiding students with questions. Give a warning when work time is about to finish. Estimate this based on when most groups finish the last comparison (about 10-12 minutes).
As you circulate, take note of the various statements that the groups have written. Make a note of the statements you want students to share with the class. Some of the statements may be outstanding, while others may require some work. Refer to the shape set's sample responses (M-7-6-3_Shape Set Sample Record).
As responses are shared for each pair, suggest ideas that could assist to more precisely compare the figures. Make sure to explain the importance of comparing the ratios of the corresponding sides.
After discussing all of the shape pairs, bring up congruence and similarity.
"Some of our shape pairs had identical shapes and sizes. Could you name them?" (E and F, K and L)
"These pairs of figures are known as congruent. We have a special symbol to represent congruence that looks like an equal sign with a squiggle above it." (Example: Draw the symbol between two figure names, such as triangle ABC and triangle DEF, or rectangle E and rectangle F.)
"On your record sheet, go to the pairs of figures E and F, K and L. Include the phrase CONGRUENT FIGURES below your comparison statement. Can I get a volunteer to remind us why these figures are congruent?" (same general shape and size, all pairs of corresponding sides are congruent, all pairs of corresponding angles are congruent)
"Now, look for a pair of figures that are similar but not the same size. If there are any pairs that are proportional in size they are called mathematically similar. Please label them on your record sheet. The characteristics you are looking for include the same general shape, pairs of corresponding sides that all have the same ratio, and pairs of corresponding angles that are all congruent. Which pairs did you label as "SIMILAR FIGURES?" (A and D, C and D, G and H)
"The special symbol for similarity is just the squiggle." Use an example, such as Square A ~ Square B. Explain how to use the vertex letters ∆ABC ~ ∆XYZ.
"We also have two pairs of figures left that are neither congruent nor similar. Can you explain why?" (They have about the same general shape, but when you check the corresponding sides they have different ratios, and when you check the corresponding angles they are not equivalent.)
"Please label these pairs of figures (I and J, M and N) as NEITHER on your record sheet."
Checkpoint: Before proceeding to the next activity, ask students numerous questions to ensure their understanding.
Introducing Scale Factor
“On our record sheets, we compared the figures by examining pairs of corresponding sides and angles. This provided the information we needed to assess if the figures were congruent, mathematically similar, or neither. Another piece of information is particularly useful for comparing figures, solving problems, and creating detailed drawings of various types, including maps. This is the scale factor. We had already evaluated all we needed to determine the scale factor in our previous activity.”
"We stated on our record sheet that square A and square B had corresponding sides with ratios were all 4:8 or 1:2 (\(1 \over 2\)). Did anyone write your ratios were 8:4 or 2:1?"
"It depends on your reference point. If you looked at A first and then compared it to B, which is larger, you got 4:8 or 1:2. If, on the other hand, you looked at B first and compared it to A, which is smaller, you would have stated 8:4 or 2:1."
"When using scale factor, it is important to understand which direction you are comparing. Figures A and B have a scale factor of 2 if we looked from small (A) to large (B), because each side must be multiplied by 2 to make the enlarged figure. However, if we wanted to go from B to A, this would reduce the size of the square, so we would multiply by \(1 \over 2\) to achieve the reduced figure size." Examine several additional instances of your own or other pairs of similar figures from the record sheet.
Emphasize the following key concepts:
The scale factor is the number multiplied by the original figure's side lengths to produce the image, and it might be a fraction or a decimal.
It is important to understand if you are moving from small to large (enlargement) or large to small (reduction).
When two figures are compared, the one labeled without prime symbols is the original figure (A, B, C, D). You are transforming into the figure labeled with prime symbols, which is known as the image (A', B', C', D' ). Different sets of letters may be used for the two figures, such as triangle ABC transforming into triangle XYZ. In this situation, one figure will be labeled "pre-image" and the other will be labeled "image" or "original" and "new."
The scale factor for all pairs of corresponding sides in congruent figures is 1 since they remain the same size.
When a figure is being reduced, a scale factor < 1 is used to "shrink" the side lengths.
When a figure is being enlarged, the scale factor >1 to increase the side lengths.
In congruent and similar figures, all pairs of corresponding angles are always congruent and never change according to the scale factor of the sides.
Scale Factor and Similarity Graphing Activity
Students should complete this activity individually or in pairs. They will plot the points listed on the activity sheet. The points must be connected in order and labeled with the indicted letters. Each problem will generate two similar polygons on each coordinate axis. Students will use grid squares to indicate the side lengths all around both figures. They will calculate the scale factor of the sides, perimeter, and area for each figure.
Give each student a copy of the Scale Factor Labsheet (M-7-6-3_Scale Factor Labsheet and KEY).
Allow for 15-20 minutes of work, but be flexible dependent on student needs. Keep track of each student's work. Assist students who may require more direction. Ask students who seem to be very proficient to explain the relationship between the perimeters or areas of one pair of similar figures.
When the students have done, call on pairs to present each problem. If students present inaccurate information or use illogical steps, aid them with guiding questions that point them in the correct direction. Encourage the rest of the class to make any necessary modifications to their own papers during the presentations.
Wrap up this activity by summarizing the characteristics of similar figures. Extend the idea that the pairs of corresponding sides all have the same scale factor to include the information that the perimeters of each pair had the same scale factor as the corresponding sides, but the areas were increased or reduced by the square of the scale factor.
Partner Activity: Similarity Applications
Tell students, "We're going to apply what we learned about scale factor in the previous activity to solve some similarity questions. If you know that two figures are mathematically similar, you can calculate the scale factor for the entire image by measuring the lengths of just one pair of corresponding sides."
"Remember the star problem from the beginning of the lesson. If you were told that the stars were similar, you could have calculated the scale using a single set of corresponding sides whose measurements were both given. Once you got the scale factor, you could use it to identify missing values for pairs of sides with only one length provided. Let's practice identifying some missing side lengths."
Go over a few samples. Emphasize that students must observe whether the image is an enlargement or reduction in order to accurately identify the scale factor. Include one or two polygon defects with missing lengths on the original figure and a missing length on the image.
Show students how to divide the triangles to better see the two similar triangles. This will be a difficult task for numerous students.
To calculate the scale factor, divide a pair of corresponding side lengths we know. For example, 38.5 ÷ 55 = 0.7 (check it: 55 x .7 = 38.5), hence the scale factor 0.7 multiplied by 84 gives us the missing distance across the pond:
84 × .7 = 58.8 ft
If students need extra teaching, provide more examples like these. More examples are available (M-7-6-3_More Work with Similarity).
Students should practice finding missing values by completing the Similarity Applications practice sheet (M-7-6-3_Similarity Applications). This can be done with an a partner. Plan for 15 minutes of work time, or if time is limited, send the sheet home as an individual assignment and review it the following day. Before going on to the map reading segment of the lesson, review student work and clarify any misconceptions.
To assess students' understanding, provide the Exit Ticket for Lesson 3 (M-7-6-3_Exit Ticket Lesson 3 and KEY).
Extension:
Discuss how important it is to comprehend and use the appropriate vocabulary phrases while communicating mathematical ideas. During this lesson, students should record the following terms in their vocabulary journals: congruence, corresponding, scale factor, similarity. Keep a supply of vocabulary journal pages on hand so that students can add them as needed. Bring up examples when scale factors are required to solve real-world challenges that have occurred over the school year. When presenting scale factor, use examples from different subject areas such as maps (social studies), recipes (home skills class), scale drawings (art and drafting). Ask students to bring in maps and scale drawings from magazines or newspapers. Distinguish between working with scale factor for reductions and enlargements. Emphasize the difference between similar and congruent figures.
Small Group: Rethinking Congruence and Similarity: Provide each student a grid paper for graphing Figures A-H (M-7-6-3_Grid Size 6). Give each student or pair of students a list of the figure coordinates shown below (M-7-6-3_Rethinking Similarity and KEY). Ask students to graph each figure individually on grid paper.
Examine students' graphed figures (M-7-6-3_Rethinking Similarity and KEY). Discuss with the students the characteristics of similar and congruent figures. Students should make a comparison statement about the four pairs of figures based on their congruence or similarity. (For example, Figure A and Figure E are similar since all pairs of corresponding sides have the same ratio of 3/8 and all pairs of corresponding angles are equivalent.) Allow students to collaborate with a partner to create their statements. Insist that the statements are clear and specific, including the comparison of corresponding parts. If time allows, allow students to find the ordered pairs required to generate additional reductions and/or enlargements of mathematically similar figures.
Station 1: Ask the Class: Instruct students who may be going beyond the standards to build an embedded triangle problem. Request that students create an answer key with explanations to be attached to the problem's poster. Allow time for students to submit their questions and receive comments from the class. Place these around the room or in the station area if there is enough space.
Station 2: Morph Your Character: This activity builds on the efforts of any student who created a character at the Create a Character Station during Lesson 2. Students will use their previous character and the coordinate pairs listed on the record sheet. Students will develop a rule using a scale factor to reduce or enlarge their previous character.
They can use rules like (\(1 \over 2\)x, \(1 \over 2\)y) or (2x, 2y) to generate a mathematically similar character, or (2x, 4y) or (\(1 \over 3\)x, 3y) to make a non-similar morphed character. Once the rule has been decided, it will be applied to each ordered pair in the table that included the original character. These ordered pairs should be recorded alongside the preceding values on the existing record sheet or a new record sheet (M-7-6-3_Morph Your Character). Request that students graph the list of ordered pairings to see what the new version of their character looks like. For the enlargements, a larger chart paper grid and additional grid lines may be required. Another option to enlarge a graph, glue four 8.5" x 11" pieces of grid paper on chart paper to make the 4 quadrants of a larger graph.
If a student has not yet created a character, he or she can do this activity by going back and completing the Lesson 2 station first.
Congruency, Similarity, and Scale Factor (M-7-6-3)
In this lesson, students will learn how to identify congruent and similar figures. They will base their conclusions on the relationship between corresponding parts in pairs and sets of figures. Students will apply the concept of scale factor to the changes in figures when they are reduced and enlarged. Students will:
- identify congruent and similar polygons.
- explain what characteristics determine similarity and congruence.
- determine the relationship between the scale factor, perimeter, and area.
- graph figures with their images (congruent, similar, and non-similar).
- write and apply rules for reducing and enlarging figures, such as (x, y) → (2x, 2y).
- consider the congruence and similarity of circles.
- use congruence and similarity concepts to solve problems involving missing values.
- apply the concept of scale factor to drawings and maps.
