


























Views
Downloads



Complete Probability Tables Worksheet | Grade 12 Statistics
Paste this activity's link or code into your existing LMS (Google Classroom, Canvas, Teams, Schoology, Moodle, etc.).
Students can open and work on the activity right away, with no student login required.
You'll still be able to track student progress and results from your teacher account.
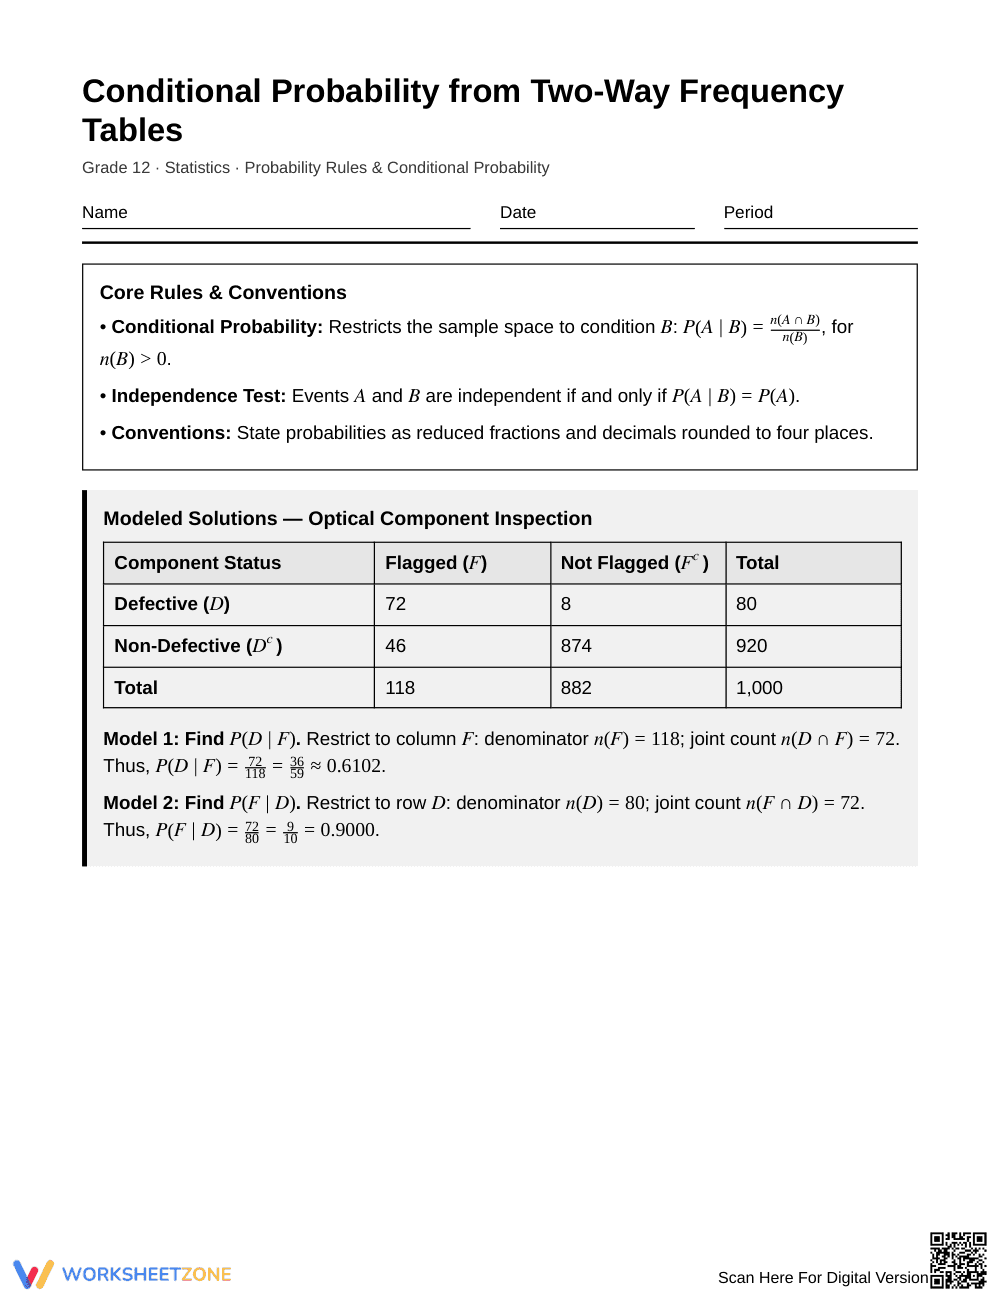
This high school statistics worksheet equips Grade 12 students to calculate conditional probabilities and evaluate independence using two-way frequency tables. Learners transition from reading joint and marginal counts to interpreting real-world screening scenarios, developing fluency with conditional notation and distinguishing between condition and event outcomes.
At a Glance
- Grade: 12 · Subject: Statistics
- Standard:
HSS-CP.A.4— Construct and interpret two-way frequency tables to find probabilities and assess independence- Skill Focus: Conditional probability from two-way tables
- Format: 5 pages · 12 problems · Answer key included · PDF
- Best For: Core instruction, guided practice, and test review
- Time: 40–50 minutes
What's Inside
This 5-page printable resource contains 12 focused statistical problems paired with two modeled solutions and a 2-page complete answer key. Students reference structured formula rules before completing fill-in-the-blank joint frequency ratios, calculating sensitivity and positive predictive value from authentic data contexts, and writing written justifications that diagnose common probabilistic fallacies.
Skill Progression
- Guided practice (Tasks 1–4): Scaffolded transit screening tasks provide step-by-step prompts for condition totals and joint counts, culminating in an initial independence test.
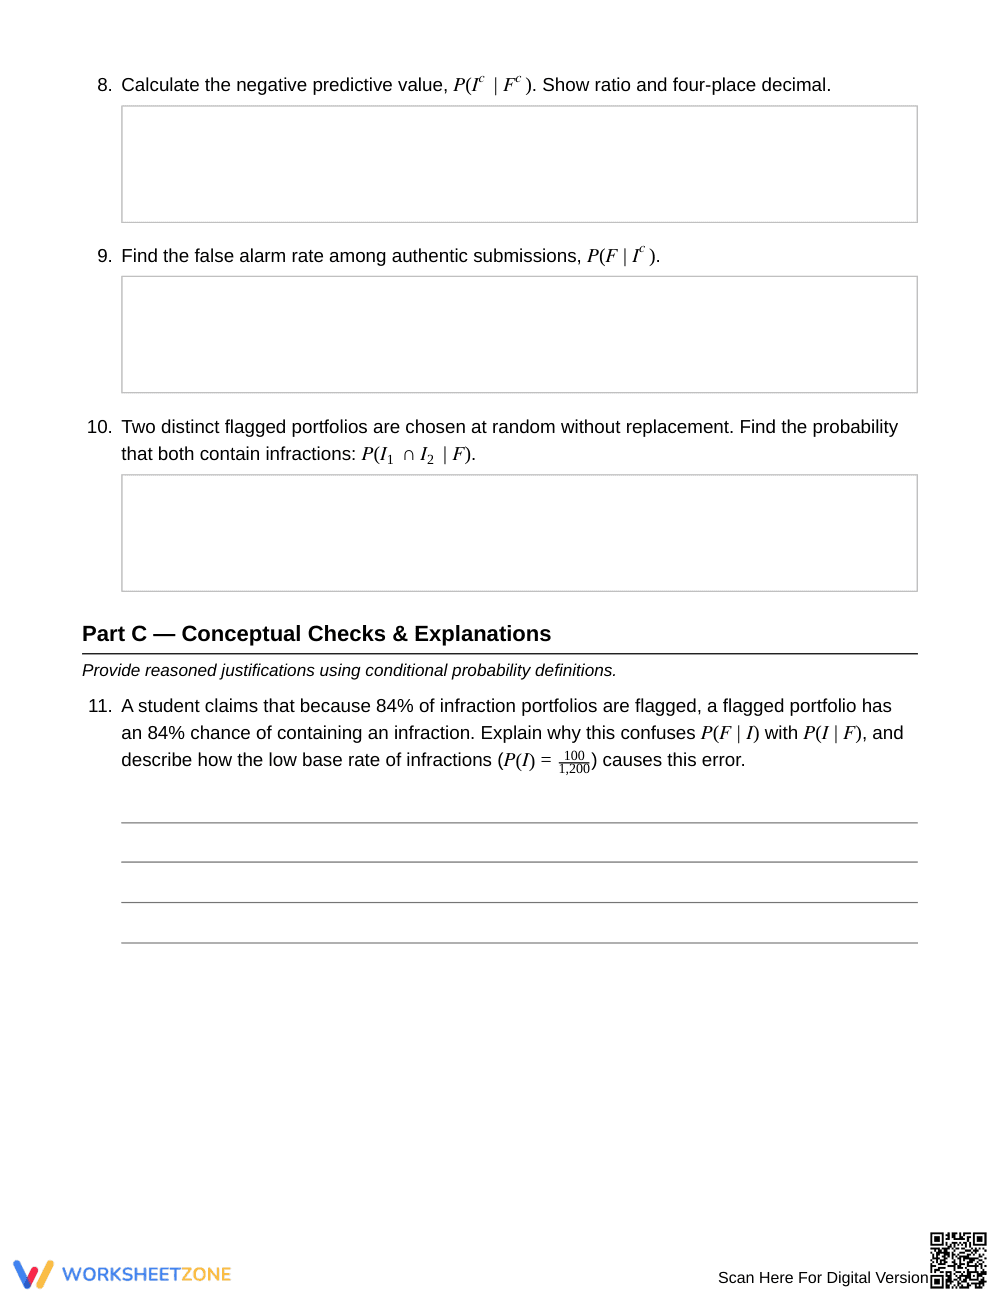
- Supported practice (Tasks 5–10): Unscaffolded originality screening items require students to independently compute marginal rates, sensitivity, positive predictive values, and compound probabilities without replacement.
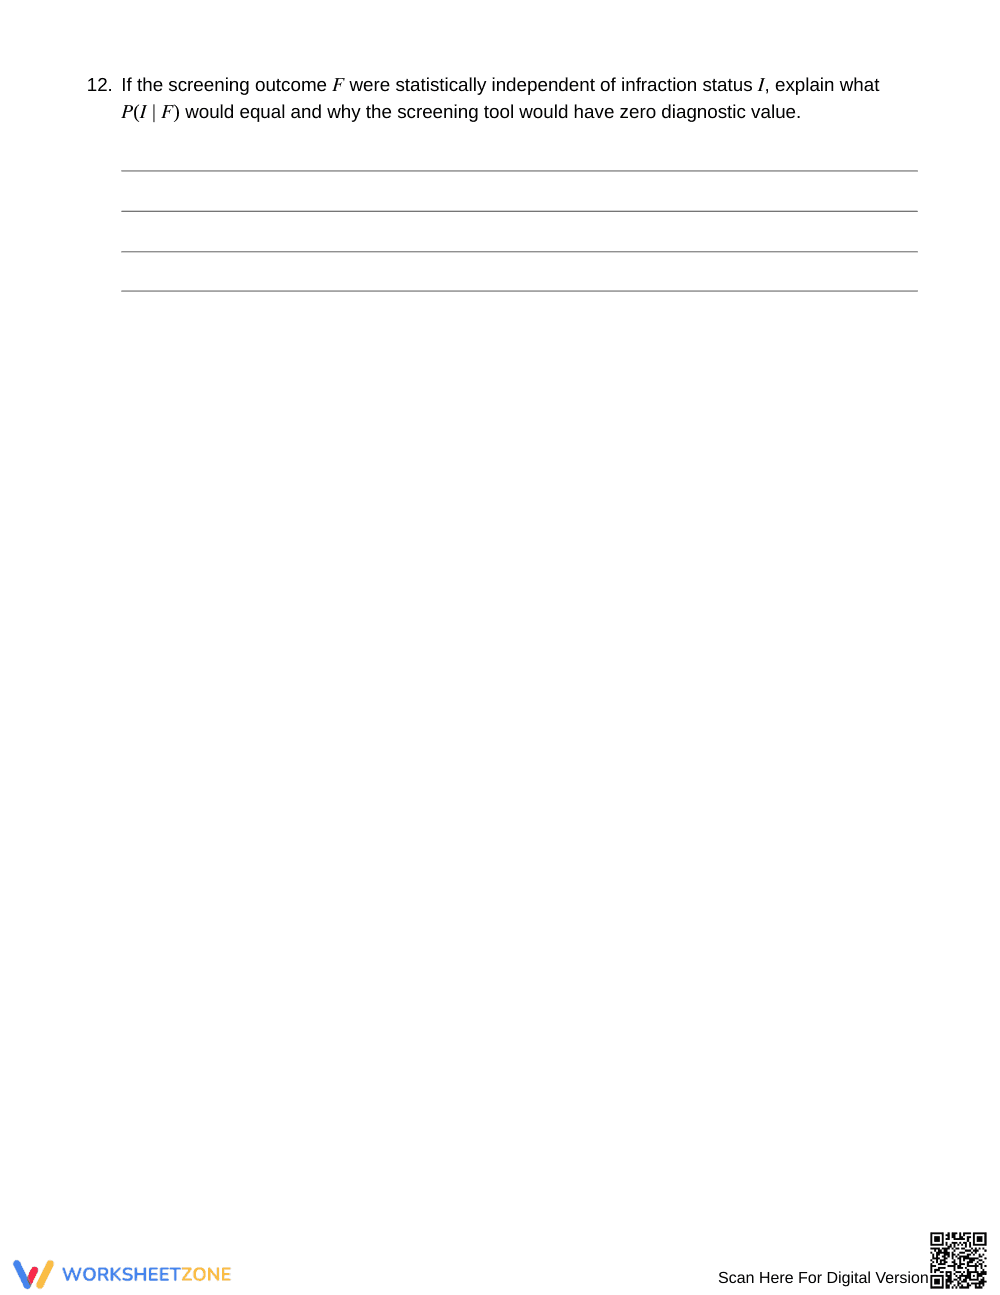
- Independent practice (Tasks 11–12): Open-response conceptual checks challenge learners to explain the fallacy of transposed conditionals and evaluate diagnostic utility when variables are independent.
This systematic structure mirrors the gradual-release framework, moving learners from modeled frequency extraction to independent analytical reasoning.
Standards Alignment
This worksheet directly aligns with HSS-CP.A.4: Construct and interpret two-way frequency tables of data when two categories are associated with each object being classified, using the two-way table as a sample space to decide if events are independent and to approximate conditional probabilities. In addition, the material reinforces HSS-CP.A.5 by requiring students to apply conditional probability concepts to everyday diagnostic testing scenarios. Both standard codes can be copied directly into lesson plans, IEP goals, or district curriculum mapping tools.
How to Use It
Deploy this worksheet immediately after direct instruction on conditional formulas, using the transit table in Part A for paired collaborative problem solving. During independent completion of Part B, observe whether students correctly identify the conditioning event in the denominator rather than dividing by the grand total. The 12-task progression requires 40 to 50 minutes of instructional time, making it ideal for standard class periods or targeted review sessions.
Who It's For
This resource is designed for Grade 12 Statistics, AP Statistics, and advanced algebra courses. It offers built-in scaffolding for emerging statisticians while providing rigorous contextual analysis for advanced students. Pair this activity with an interactive anchor chart defining sensitivity and base rates to reinforce conceptual connections.
Mastering conditional probability from two-way frequency tables under standard HSS-CP.A.4 establishes foundational statistical literacy required for postsecondary data analysis and evidence-based decision making. As documented by Fisher & Frey (2014), structuring instructional tasks with intentional gradual release—moving from scaffolded table cell identification to independent interpretation of positive predictive value—significantly improves conceptual retention and procedural accuracy. High school seniors frequently struggle to distinguish between the condition and the primary event, often confusing the probability of a positive test given an infraction with the probability of an infraction given a positive test. By grounding 12 targeted mathematical exercises in realistic quality control, security screening, and diagnostic contexts, this resource guides students to correctly restrict the sample space and verify statistical independence. The included worked models and conceptual prompts reinforce rigorous quantitative communication across secondary mathematics curricula.


