




























Views
Downloads

Complete Heating-Curve Plateau Worksheet | Grade 7 Science

Paste this activity's link or code into your existing LMS (Google Classroom, Canvas, Teams, Schoology, Moodle, etc.).
Students can open and work on the activity right away, with no student login required.
You'll still be able to track student progress and results from your teacher account.
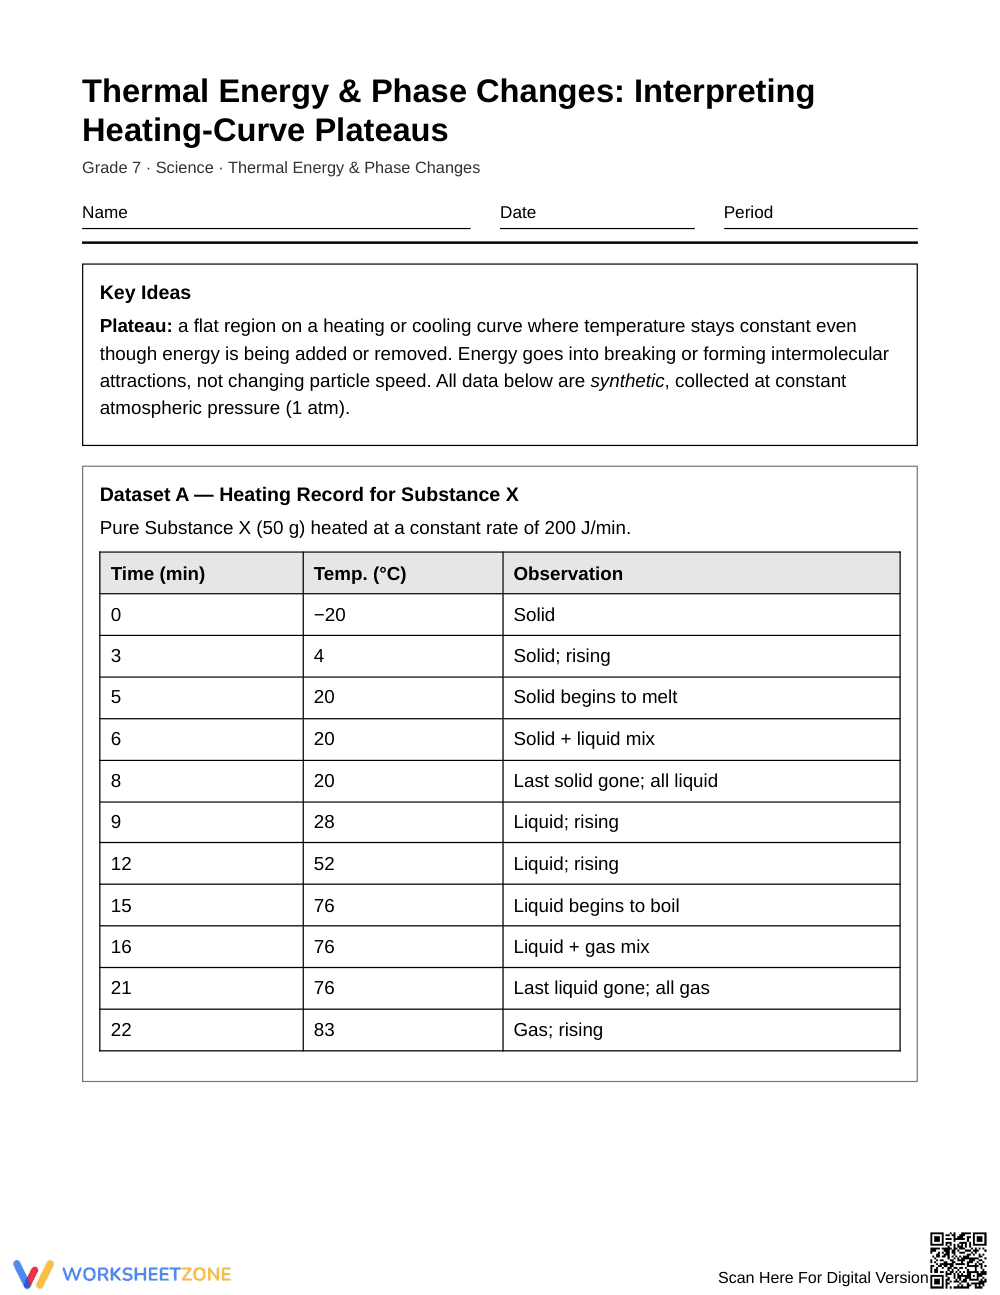
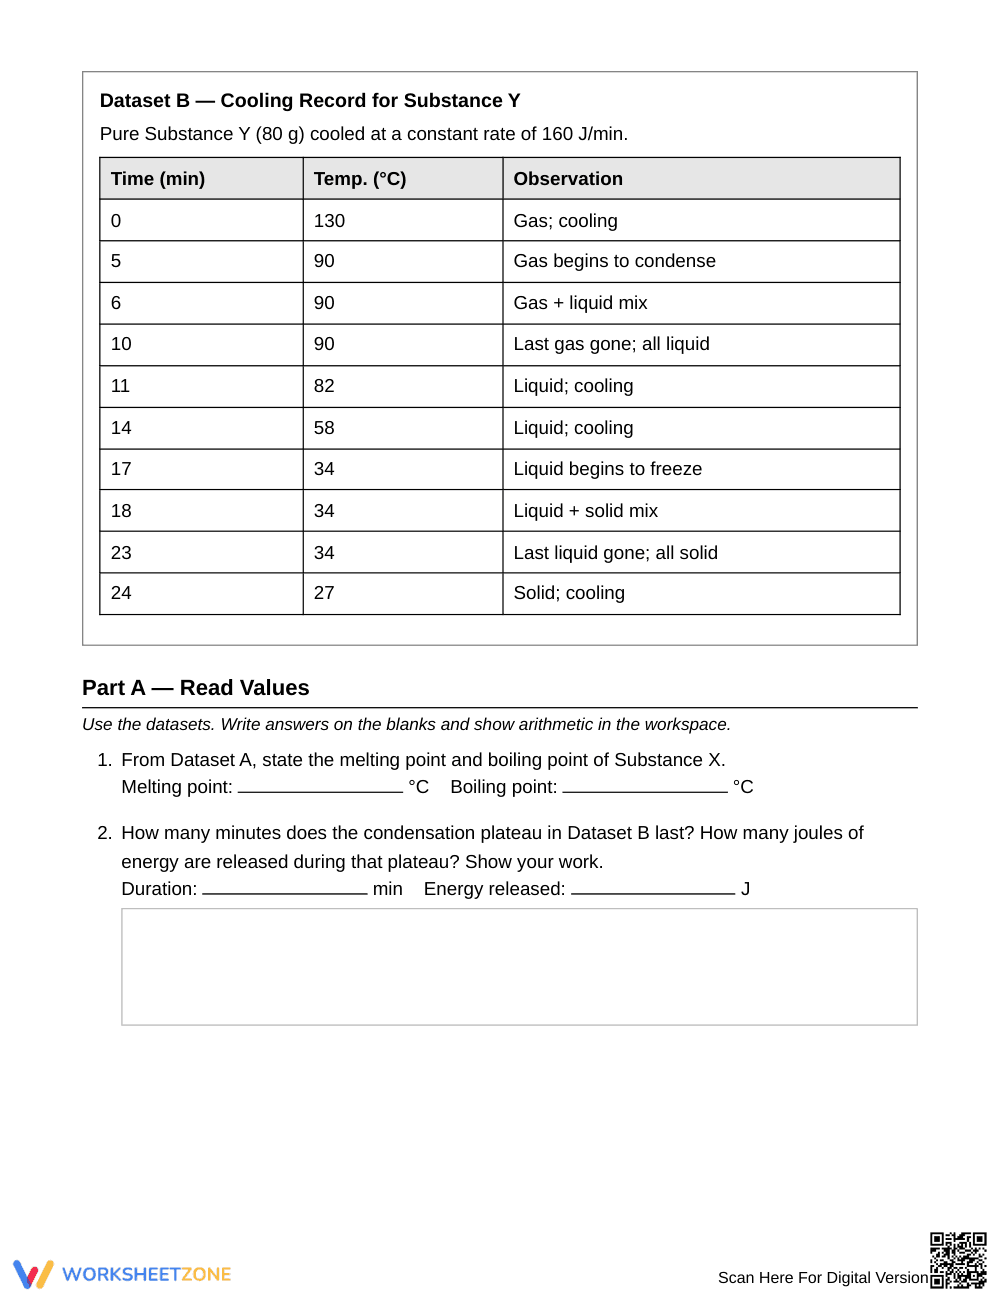
This Grade 7 science worksheet builds mastery in interpreting heating and cooling curve plateaus. Students examine synthetic datasets to determine melting points, boiling points, and energy transfer during phase changes, connecting macro-level temperature data to particle-level physical models.
At a Glance
- Grade: 7 · Subject: Science
- Standard: State Physical Science Standards — Develop models to describe changes in particle motion during phase changes
- Skill Focus: Heating-curve plateau data interpretation
- Format: 5 pages · 10 problems · Answer key included · PDF
- Best For: Independent thermal energy practice
- Time: 35–45 minutes
What's Inside
The 5-page printable resource includes two comprehensive synthetic datasets (heating Substance X and cooling Substance Y), 10 analytical problems, and a 3-page complete answer key with worked calculations and sample explanations. A foundational reference box clarifies constant-temperature energy absorption and intermolecular forces.
Skill Progression
- Guided Practice (Part A, Problems 1–2): Direct data extraction where students read plateau temperatures, calculate duration, and compute total joules transferred with structured prompts.
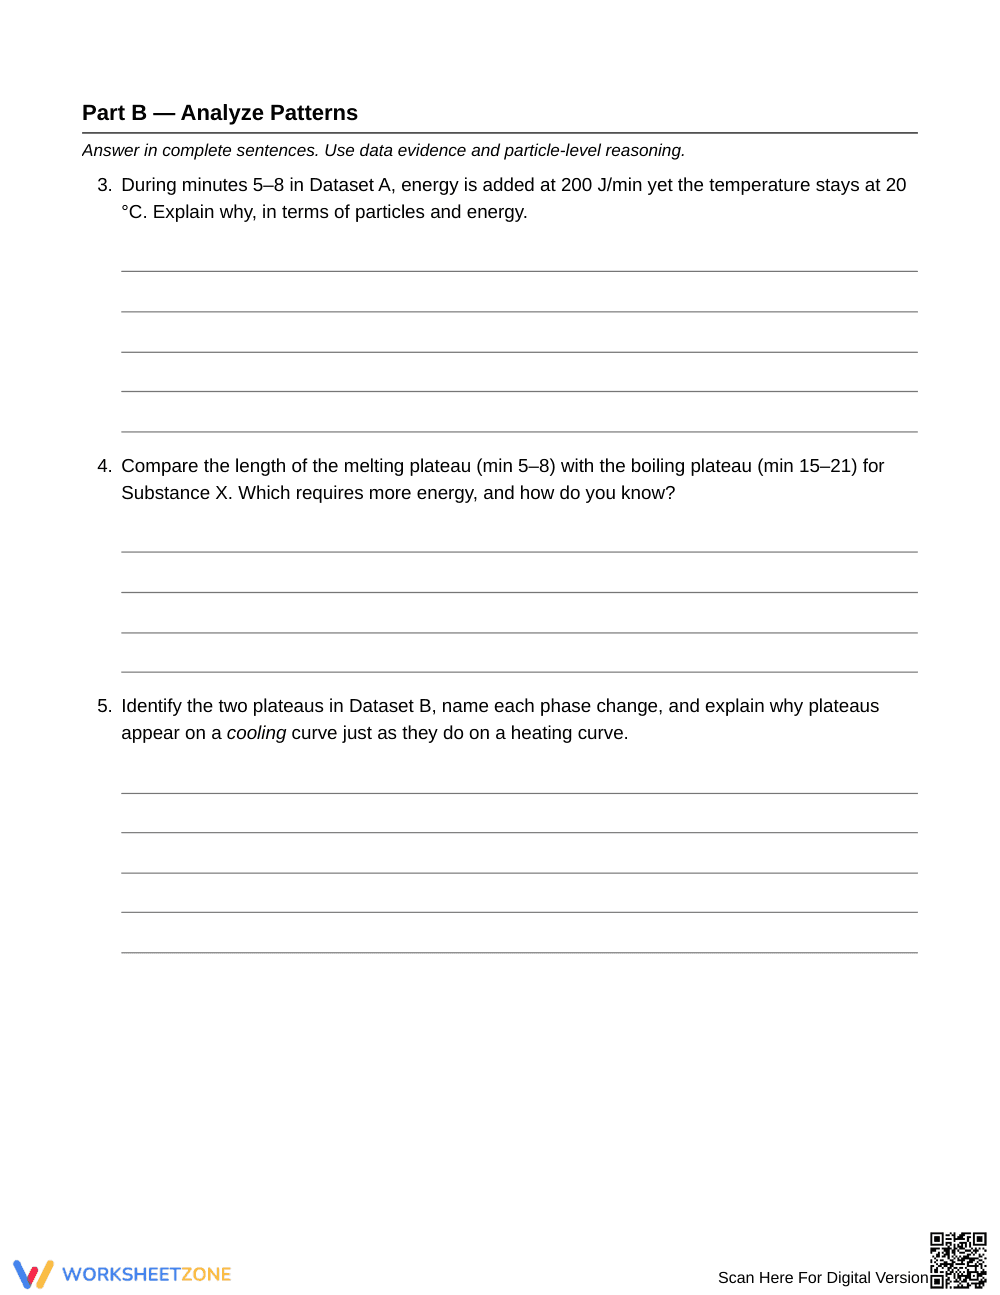
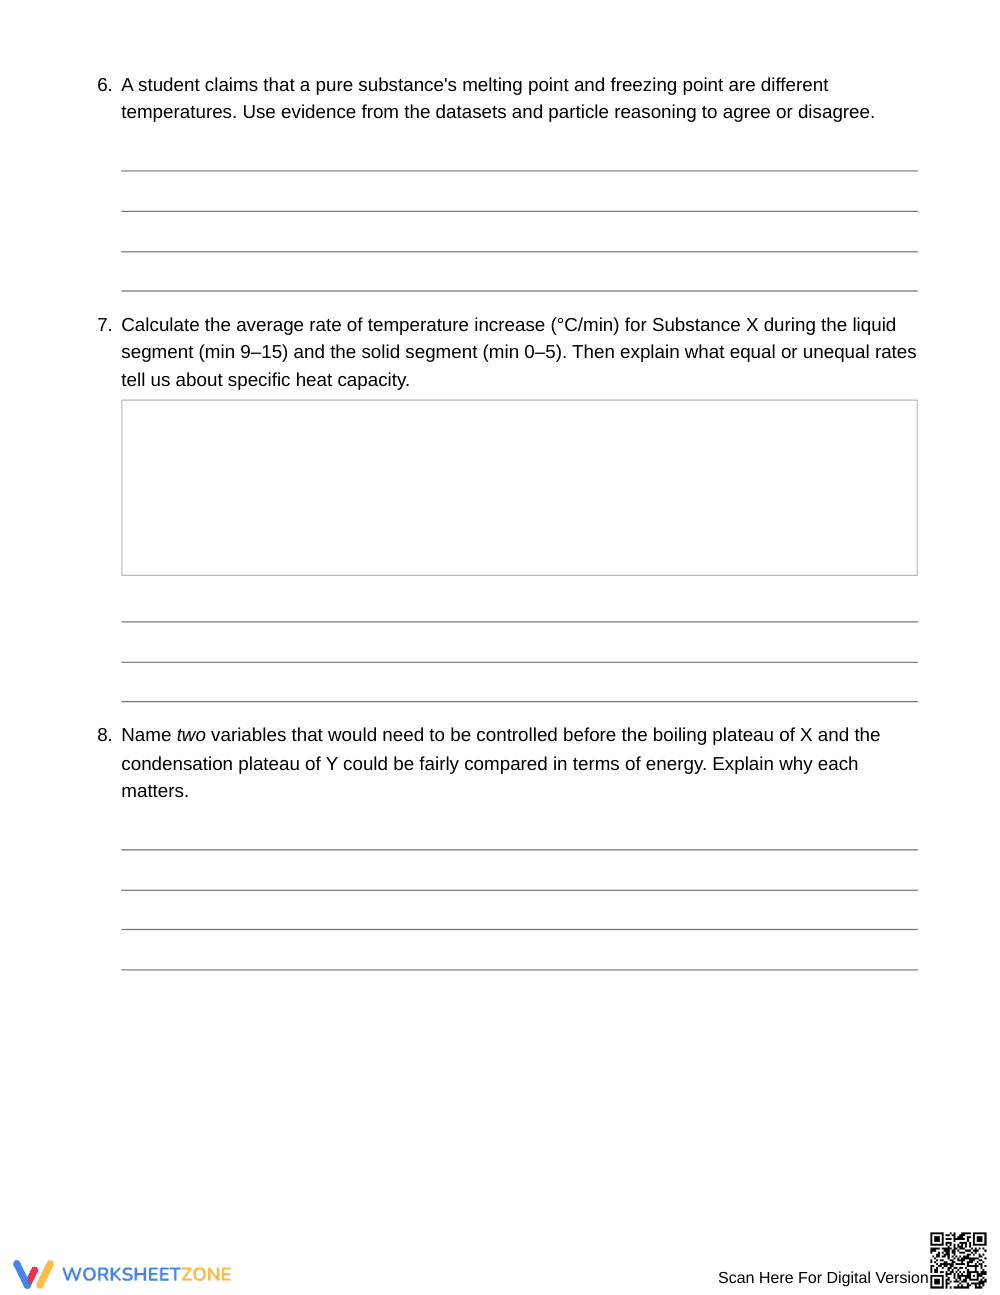
- Supported Practice (Part B, Problems 3–8): Conceptual analysis requiring complete sentences, particle-motion reasoning, specific heat comparisons, and experimental control identification.
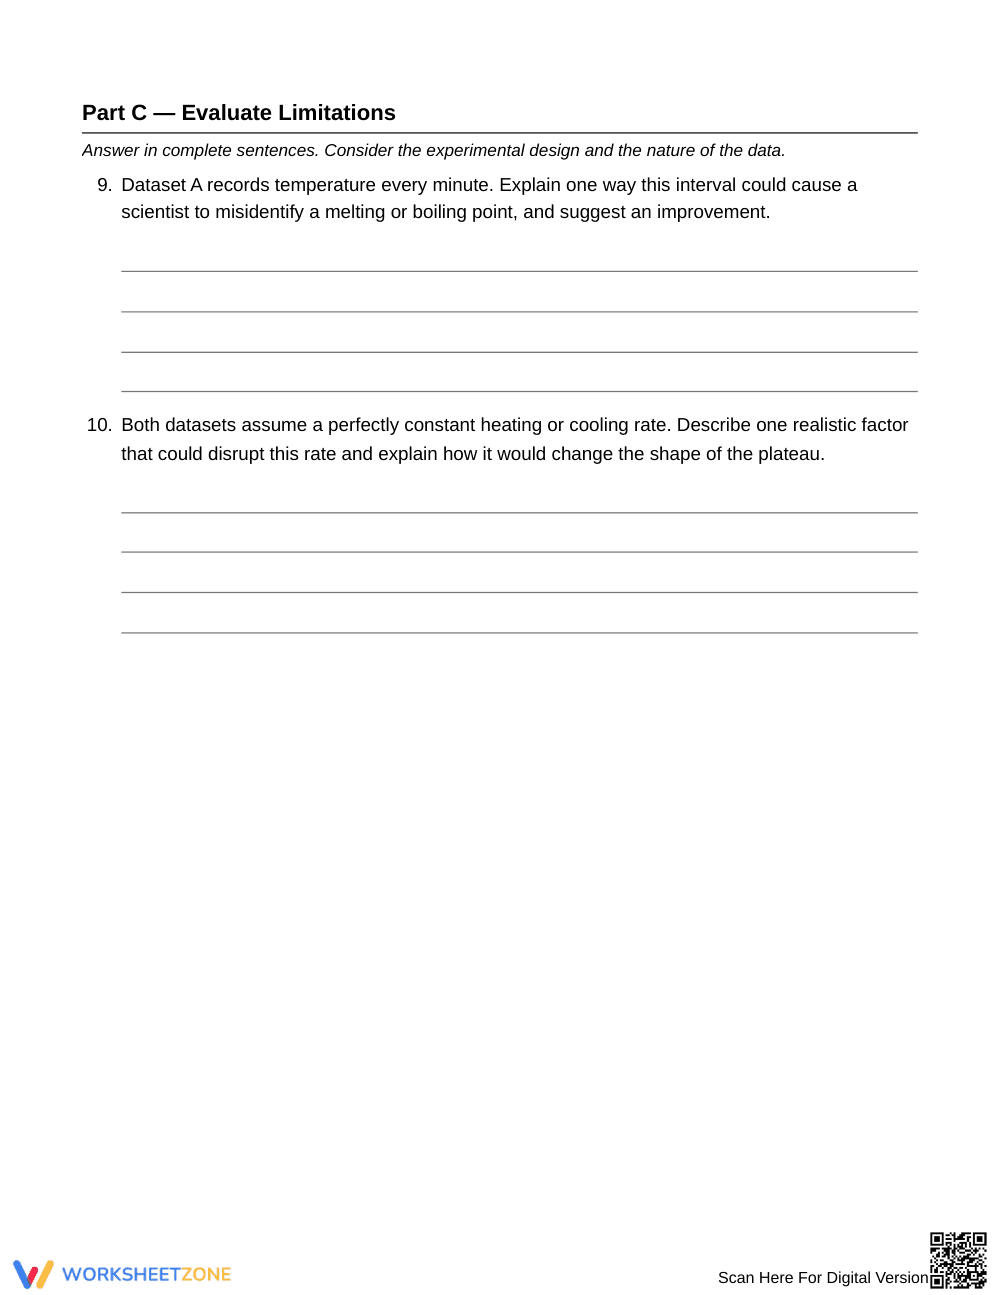
- Independent Practice (Part C, Problems 9–10): Higher-order evaluation tasks where students critique sampling intervals and identify experimental factors that distort plateau shapes.
This structured progression follows a gradual-release instructional framework to move students from basic graph reading to robust physical science evaluation.
Standards Alignment
This worksheet aligns with middle school physical science standards addressing thermal energy, states of matter, and particle interactions. Students demonstrate how energy input alters potential energy rather than kinetic energy during phase transitions. Both standard codes can be copied directly into lesson plans, IEP goals, or district curriculum mapping tools.
How to Use It
Assign this resource after direct instruction on thermal energy and kinetic molecular theory. For formative assessment, examine student answers on Part B to identify whether learners correctly attribute constant temperatures to bond breaking rather than cessation of heat transfer. Expected completion time is 35 to 45 minutes.
Who It's For
Designed for general Grade 7 science classrooms, physical science units, and introductory chemistry modules. The structured arithmetic workspaces assist struggling learners, while the limitation critique in Part C offers rigorous depth for advanced students. Pair this activity with a hands-on ice-melting lab.
Middle school science curricula demand that students interpret empirical data to explain macroscopic thermal phenomena through sub-microscopic molecular behavior. According to research on science instructional design by Fisher & Frey (2014), structured data analysis tasks that transition from explicit value identification to written mechanistic explanations significantly increase conceptual retention in middle school physical science. This 10-item thermal energy worksheet establishes rigorous practice with heating and cooling curve plateaus, asking Grade 7 students to calculate energy transfer rates and explain why temperature remains constant during phase transitions. By integrating synthetic data analysis with particle-level reasoning, learners bridge quantitative measurement and qualitative scientific modeling. Educational practitioners can deploy this 5-page worksheet to monitor student progress toward physical science mastery and diagnose common misconceptions surrounding latent heat and phase changes.


