


























Views
Downloads



Complete Carbon & Climate Data Worksheet | Grade 12 Science
Paste this activity's link or code into your existing LMS (Google Classroom, Canvas, Teams, Schoology, Moodle, etc.).
Students can open and work on the activity right away, with no student login required.
You'll still be able to track student progress and results from your teacher account.
This Grade 12 worksheet teaches students to read carbon reservoir, carbon budget, and ice-core data, then calculate and argue from the numbers. Students finish able to compute airborne fraction, residence time, and budget imbalance, and to judge whether a claim about the recent CO₂ rise holds up against evidence.
At a Glance
- Grade: 12 · Subject: Environmental & Earth/Space Science
- Standard: Not specified — students interpret carbon data and evaluate climate claims with evidence
- Skill Focus: Carbon-and-Climate Data Check
- Format: 5 pages · 12 problems · Answer key included · PDF
- Best For: Quantitative carbon cycle review
- Time: 40–50 minutes
What's Inside
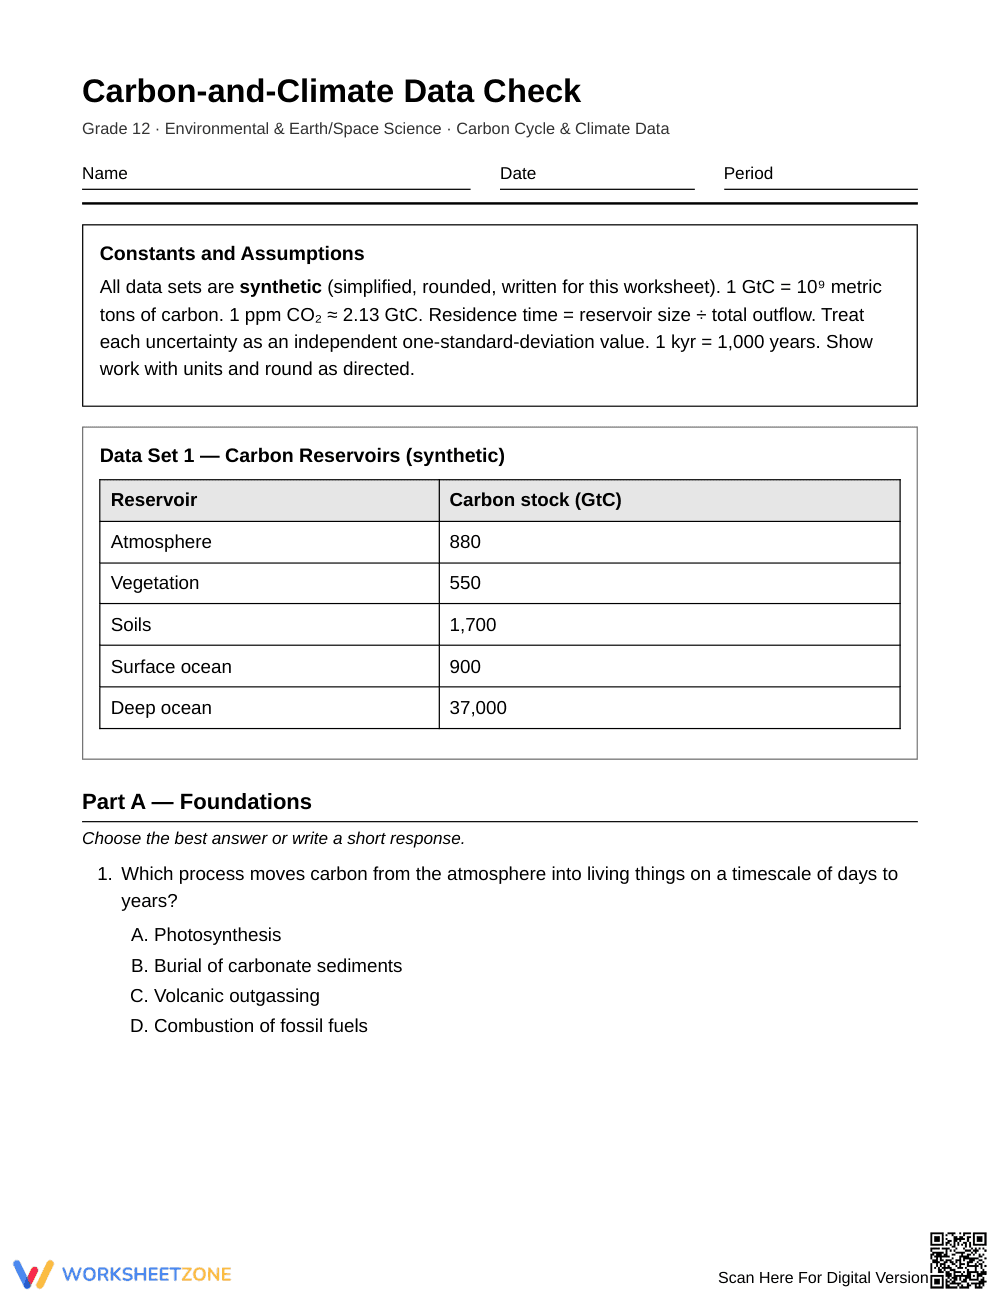
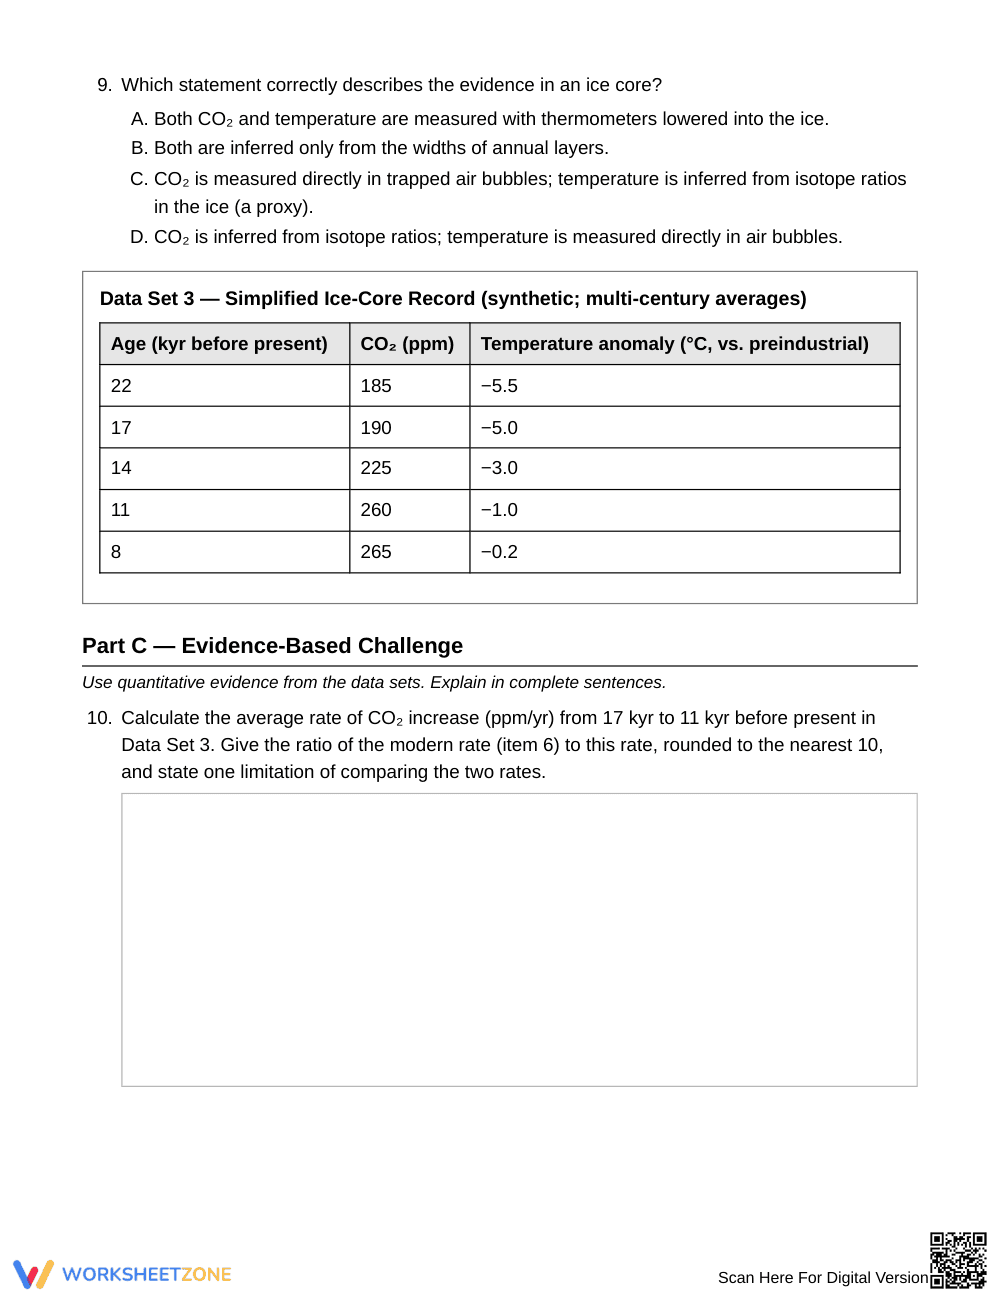
The worksheet has 12 tasks in three parts, built around three synthetic data sets: carbon reservoirs, a decade-average global carbon budget, and a simplified ice-core record. Tasks include multiple choice, calculations with units, short explanations, and one 4–6 sentence argument. A constants box lists conversions and assumptions. A 2-page answer key is included.
Skill Progression
- Guided practice (Part A, 3 problems): Identify processes, compare reservoir sizes, and tell fluxes from stocks. Data Set 1 is provided.
- Supported practice (Part B, 6 problems): Calculate total emissions, airborne fraction, ppm conversion, and residence time, then explain timescales and ice-core evidence. The constants box scaffolds each step.
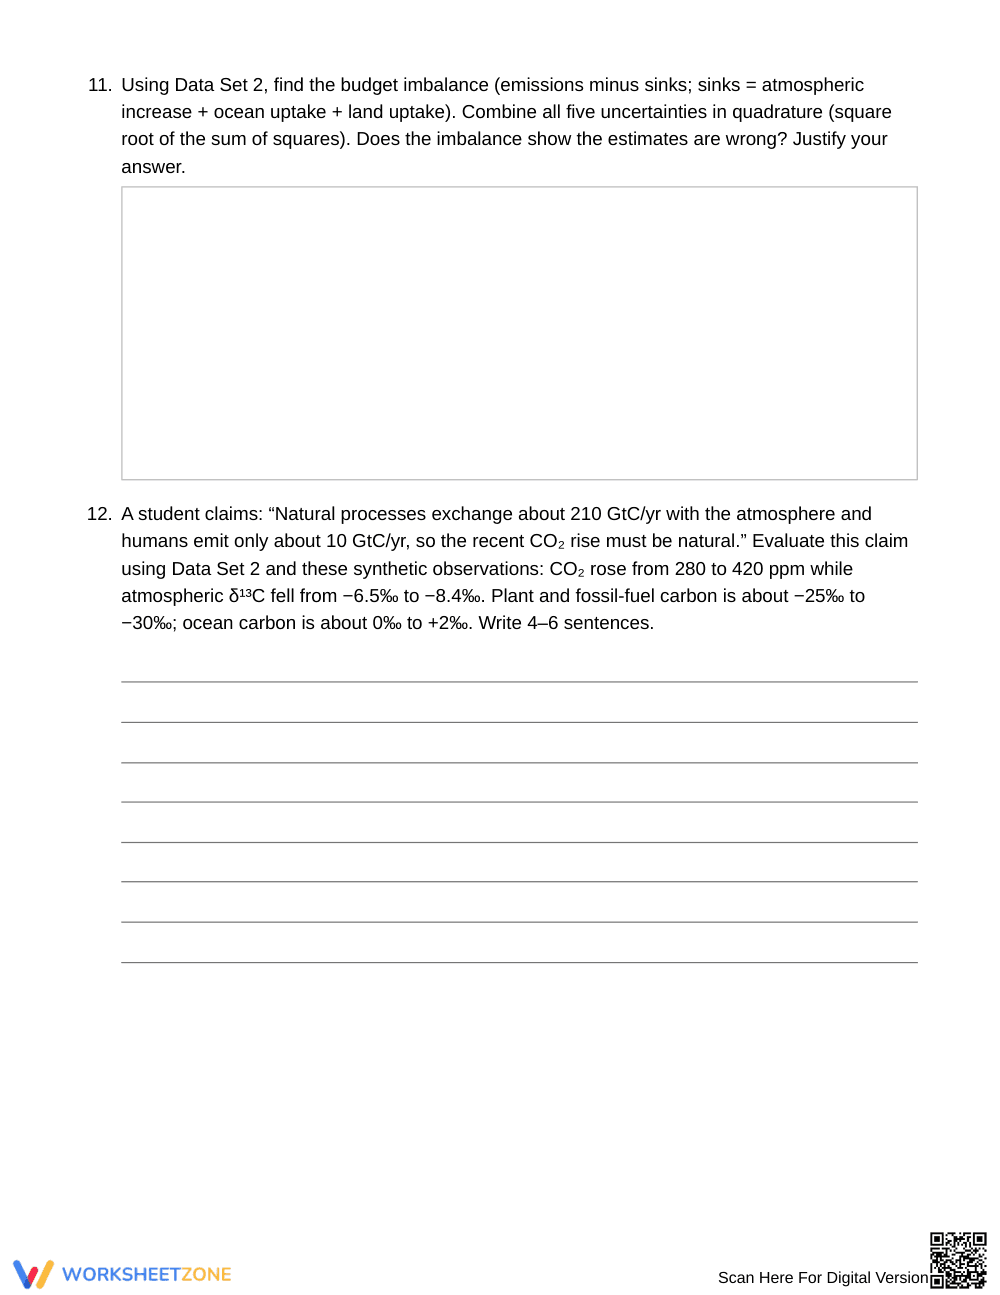
- Independent practice (Part C, 3 problems): Compare CO₂ rates, combine uncertainties in quadrature, and evaluate a claim using carbon isotope data.
This sequence follows gradual release: I Do, We Do, You Do.
Standards Alignment
No standard code was supplied for this worksheet, so none is listed here. The tasks address carbon cycle reservoirs and fluxes, human influence on atmospheric CO₂, and the use of quantitative evidence to support scientific claims. Add your state or district code to lesson plans, IEP goals, or curriculum mapping tools.
How to Use It
- After direct instruction: Assign it as in-class practice once students have covered the carbon cycle and greenhouse effect.
- Before a unit test: Use it as a review set, then go over Part C answers as a class.
While students work, watch for unit errors in items 6 and 7 and for skipped uncertainty reasoning in item 11. Expect 40–50 minutes.
Who It's For
This worksheet suits Grade 12 environmental science, Earth/space science, and advanced science students who are comfortable with ratios and basic algebra. Students who need support can complete Parts A and B first. Pair it with a carbon cycle diagram or a lesson on proxy records.
The Carbon-and-Climate Data Check is a Grade 12 Environmental & Earth/Space Science worksheet that asks students to interpret carbon reservoir, carbon budget, and ice-core data, then use calculations to evaluate climate claims. Its 12 tasks move from identifying reservoirs and fluxes to computing airborne fraction, residence time, and budget imbalance with combined uncertainty, and finish with an evidence-based argument using carbon isotope data. No standard code was supplied for this resource, so alignment should be mapped locally by the teacher. The structure follows the gradual-release model described by Fisher & Frey (2014), in which learners shift from guided work toward independent application. All data are synthetic and simplified, so students practice quantitative reasoning without relying on memorized figures. A 2-page answer key supports quick checking and consistent feedback for teachers and students alike across a single class period.


