


Keeping track of student learning shouldn’t mean waiting until the end of the week to see results. With WSZ Classroom, you can watch progress unfold in real time — spotting who’s thriving, who needs help, and how the whole class is performing. This powerful class management tool turns complex data into simple, visual insights you can act on instantly. In this guide, you’ll discover exactly how to use WSZ Classroom to monitor assignments, analyze scores, and keep every student on the path to success — all without extra paperwork.
Accessing the List Exercise Tab
Once you’ve assigned work to your class in WSZ Classroom, the List Exercise section becomes your real-time control panel. Here’s what you’ll see:
- Due Date: By default, sorting by due date helps both teachers and students quickly identify which tasks are upcoming.
- Title: Displays the name of each worksheet, ordered according to due date.
- Submit: Shows how many students have submitted their work so far.
- Progress: Displays the current status of each assignment:
- On-going – Currently active and being worked on.
- Finished – All work is completed, and the task is closed.
- Scheduled – Planned for a future start date.
- Pending – No start date has been set yet.
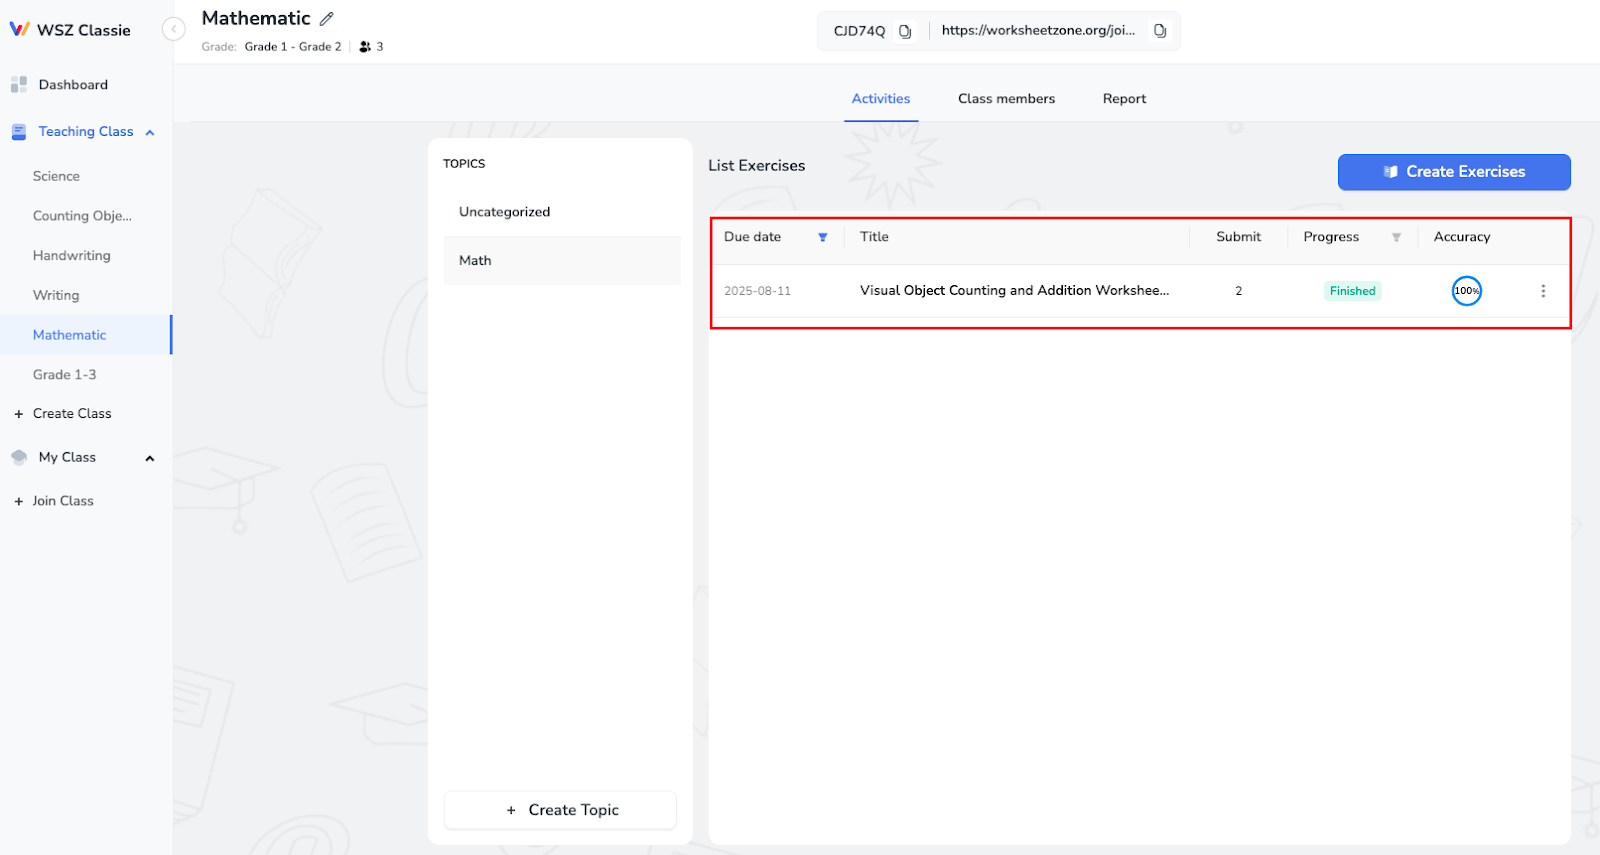
Click directly on any assignment to open detailed progress and results for that specific exercise.
Viewing Class Overview
Inside the Overview tab, WSZ Classroom gives you a quick visual of your class’s performance:
- Need Help: Automatically lists students scoring below 5 (on a 10-point scale).
- Didn’t Finish: Shows students who started but haven’t submitted yet.
- Score Distribution Chart: Shows how scores are spread across the class. You can view results in different formats:
- 10 Scale (0–10)
- Letter Grades (A–F)
- 4.0 Scale
- Score Panel: Shows the minimum, maximum, and average grades in the class.
- Time Taken Panel: Displays the shortest, longest, and average time spent on the assignment.

This section is perfect for spotting trends at a glance, like whether most students are excelling, struggling, or falling into the middle range.
Checking the Participants Tab
If you want to zoom in on individual student performance, the Participants tab is your go-to tool. Here you can see:
- Progress Status: Current state for each student’s assignment (e.g., doing, submitted, late).
- Submission Time: When the student turned in their work.
- Grade (Accuracy): Viewable in your preferred format (Accuracy%, Letter Grade, 10 Scale, or 4.0 Scale).

From here, you can select a student and click See Detail to open their full assignment breakdown.
Once you open a student’s detailed report, WSZ Classroom gives you a clear, visual snapshot of their performance:

Ending an Exercise for a Full Report
If all students finish before the due date, click End to generate a comprehensive report. Move to the Report tab, where WSZ Classroom compiles a complete performance summary for the entire class.
1. Key Performance Metrics (Top Section)
- Average Score: Shows the class’s mean score for the exercise. In the example, the class achieved 10 (perfect score).
- Participation Rate: Displays the percentage of students who completed the exercise (e.g., 66.7%).
- Average Time: Indicates the average completion time per student, measured in minutes.
- Completed Exercises: The Total number of exercises factored into these statistics.

Under these metrics, WSZ Classroom’s AI provides:
- Suggestions for improvement
- Highlights of class strengths
These insights are invaluable for adjusting teaching methods and recognizing achievements.
2. Performance Filters
- Student View – Switch between results for All Students or individual learners.
- Data Type – View reports by Topic or Exercise to focus on specific areas.

For each filter, WSZ Classroom displays:
- Average Score Bar Chart: Performance over recent topics.
- Participation Rate Chart: Displays the percentage of students who took part in each topic or exercise.
- Score Distribution: A color-coded pie chart categorizing performance levels.
- Score Over Time: A line graph showing how average scores change over different exercises or periods.

Under each chart, WSZ Classroom’s AI provides clear feedback — for example, noting if scores are improving, participation is dropping, or certain topics need revisiting.
The true power of real-time tracking lies in how you use the information. Here’s how WSZ Classroom data can shape your teaching:
- Identify Struggling Students Early: Use the Need Help list and low score alerts to set up tutoring or targeted practice.
- Recognize High Performers: Offer extension activities or leadership roles to students consistently at the top.
- Spot Participation Issues: If participation drops, consider reviewing class engagement methods or adjusting assignment difficulty.
- Refine Lesson Plans: Use topic-specific data to reteach or reinforce areas where students are struggling.
By using these insights, you can move from reactive teaching to proactive, personalized instruction.
Wrapping Up
WSZ Classroom transforms the way teachers track student progress. Instead of waiting for end-of-term results, you get instant, actionable insights that help you support students exactly when they need it. Real-time tracking means no more guessing—just clear, data-driven teaching decisions. Whether it’s spotting who needs help, celebrating improvements, or refining your lesson plans, WSZ Classroom equips you with the tools to improve learning outcomes, boost participation, and save valuable time.
Start using WSZ Classroom today and see the difference real-time tracking can make in your classroom!