


Tracking student progress is important, but turning that data into meaningful teaching strategies is where the magic happens. On WSZ Classroom, the Reports feature isn’t just about numbers; it’s a built-in teaching assistant that helps you understand each student’s learning journey, identify class-wide trends, and adjust your lessons in real time. In this guide, we’ll walk step-by-step through how to use WSZ Classroom Reports to personalize your teaching, close learning gaps, and help every student succeed.
Accessing the Report Feature
Before you can make data-driven teaching decisions, you need to know how to get to your reports quickly.
- When your students complete an activity, click End on the exercise page. This finalizes the results and generates a fresh report.

- Inside WSZ Classroom, open your class and click the Report tab. This view shows you detailed insights for the class you’re managing.
From here, the real work begins: interpreting the data and adjusting your teaching.
Understanding the Key Metrics
When you open the Report tab, the top section displays four essential metric blocks—your quick snapshot of class performance:
- Average Score: This is your class’s overall average for the latest exercise session.
- Participation Rate: Shows the percentage of students who attempted the exercise.
- Average Time: Displays the average time students spent completing the exercise.
- Completed Exercises: The total number of exercises your class has finished.
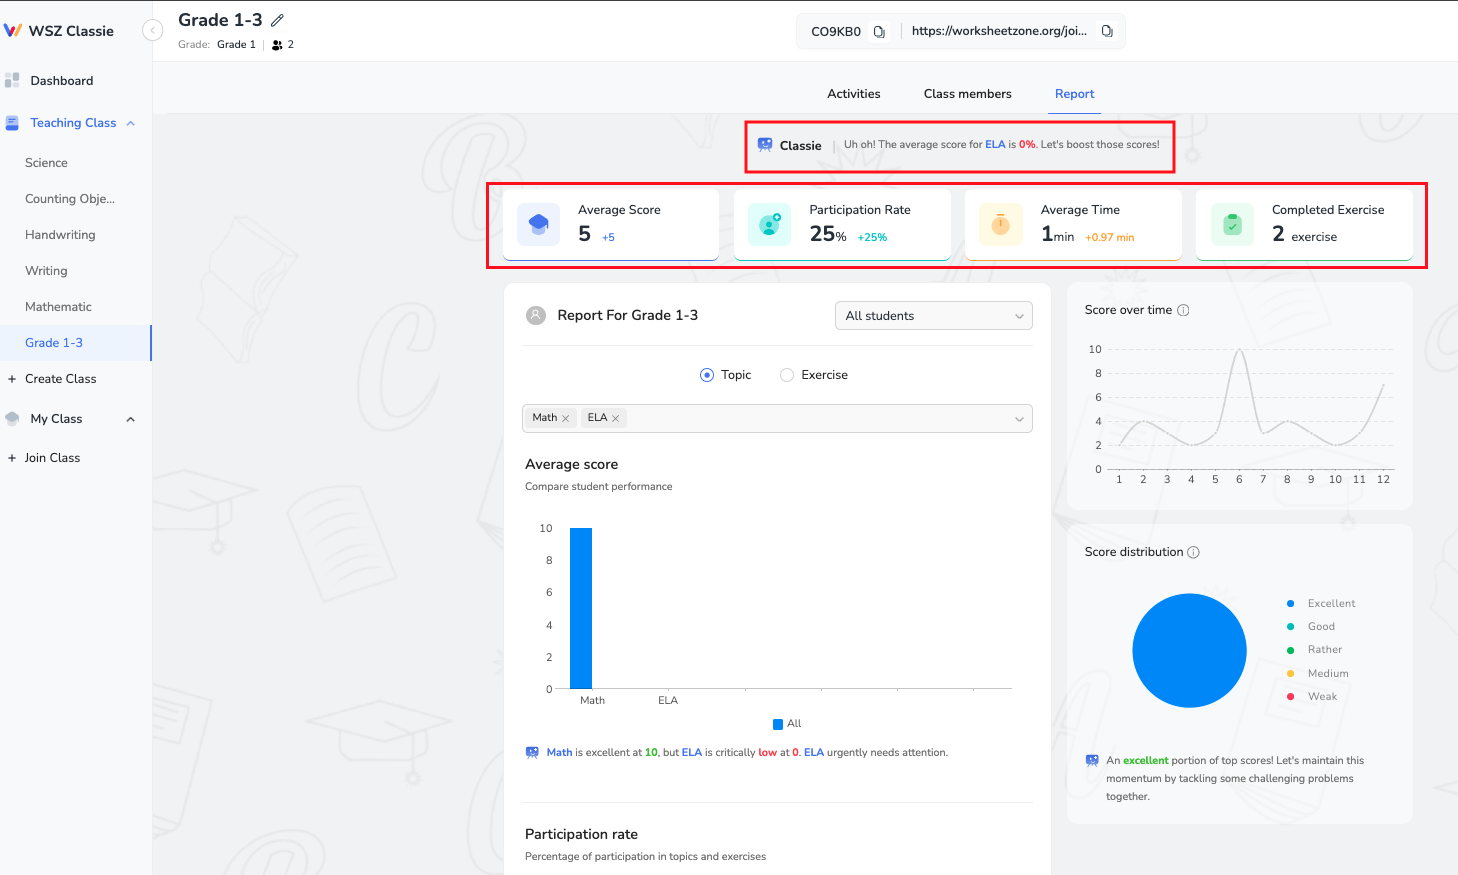
Directly under these metrics, WSZ Classroom’s AI offers quick insights—celebrating improvements, noting potential issues, and suggesting actionable changes.
Zooming In: Student and Topic Insights That Matter
Once you’ve scanned the big-picture numbers, it’s time to drill down. WSZ Classroom lets you filter your reports by individual student or specific topic/exercise, giving you a more precise look.
- By Student: Focus on one learner’s performance to spot strengths and gaps.
- By Topic/Exercise: Identify which lessons or assignments challenge the whole class.

You’ll see four detailed charts, each paired with AI-generated commentary:
- Average Score: Tracks how scores evolve topic by topic, showing trends of improvement or decline.
- Participation Rate: Highlights engagement changes, so you can pinpoint when student involvement drops.
- Score Distribution: Breaks down results into score ranges, helping you see how many students are excelling, on track, or struggling.
- Score Over Time: Displays month-by-month performance shifts for long-term analysis.

The AI adds performance feedback and motivational tips under each chart, making it easy to decide your next teaching steps.
Personalizing Teaching Based on Data
Data is powerful, but it only transforms learning when you act on it strategically. WSZ Classroom Reports give you a clear picture of who needs what, so you can deliver teaching that truly meets every student’s needs.
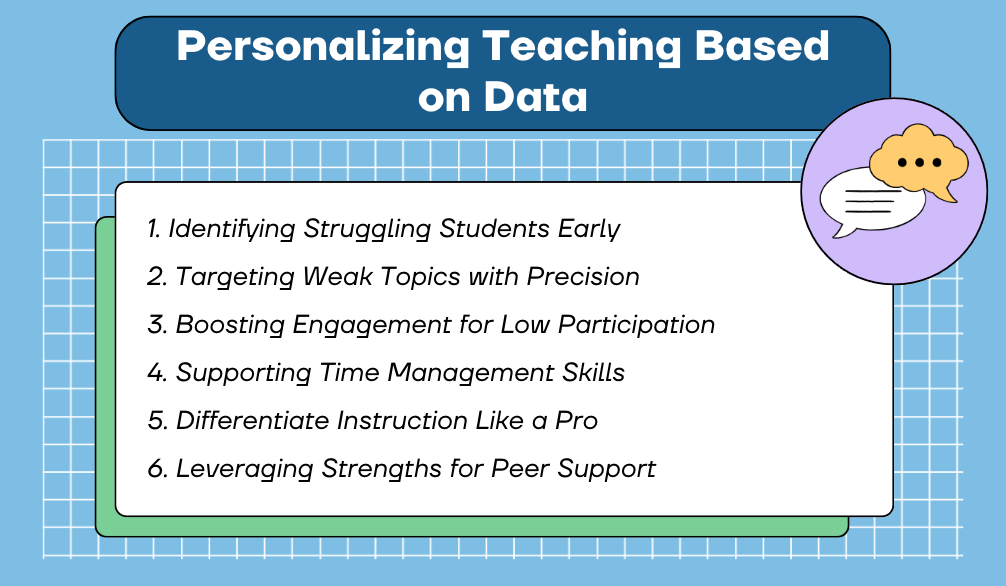
1. Identifying Struggling Students Early
The student filter lets you zoom in on each learner’s journey. If a student’s average score is consistently below the class average, or their participation rate drops from 90% to 60%, that’s your cue to act.
Tip: Schedule a quick one-on-one check-in or offer extra practice exercises tailored to their weak points. Sometimes, even a short encouragement can reignite a student’s motivation.
2. Targeting Weak Topics with Precision
Low averages in a specific topic don’t mean reteaching the whole unit—just the parts students are stumbling on.
Tip: After re-teaching, track whether the Average Score in the next attempt rises. If it doesn’t, consider changing your instructional method—perhaps switching from lecture to manipulatives or visual models.
3. Boosting Engagement for Low Participation
If the Participation Rate is consistently low for certain activities, it’s time to rethink your delivery method.
Tip: Switch up the lesson format. Incorporate gamified quizzes, group challenges, or even “student choice” activities to re-engage reluctant learners.
4. Supporting Time Management Skills
When the Average Time on task is unusually high or low, it reveals how students are processing the work. For example, an English assignment takes students twice as long as the historical average. You break the next task into shorter, timed sections to help them practice working within set limits, building both speed and accuracy.
Tip: For students consistently finishing too quickly, check if they’re sacrificing accuracy for speed and provide strategies for reviewing their work before submission.
5. Differentiate Instruction Like a Pro
Not every student learns the same way or at the same pace, and WSZ Classroom’s data makes it easy to see who’s ready to sprint ahead and who needs more time.
Tip:
- Assign enrichment projects or advanced problems to high performers.
- Provide guided worksheets, hints, or scaffolded tasks to those who need more support.
- Use self-paced assignments so everyone can progress at a comfortable speed.
6. Leveraging Strengths for Peer Support
Reports don’t just show weaknesses—they spotlight your strongest students and topics.
Tip: Use Score Distribution to see which students fall in the top tier and brainstorm enrichment or leadership opportunities for them.
Your Next Steps
WSZ Classroom’s Reports aren’t just about numbers—they’re a roadmap for smarter, more personalized teaching. They show you exactly where your class is excelling, where they’re slipping, and how to steer them toward success. Make report analysis a regular teaching habit, and you’ll see stronger engagement, higher achievement, and more confident learners.
Log in to WSZ Classroom today and start transforming your classroom data into meaningful learning progress!