


























Views
Downloads


Printable Bar Chart Data Analysis Worksheet | Grades 4-5
Paste this activity's link or code into your existing LMS (Google Classroom, Canvas, Teams, Schoology, Moodle, etc.).
Students can open and work on the activity right away, with no student login required.
You'll still be able to track student progress and results from your teacher account.
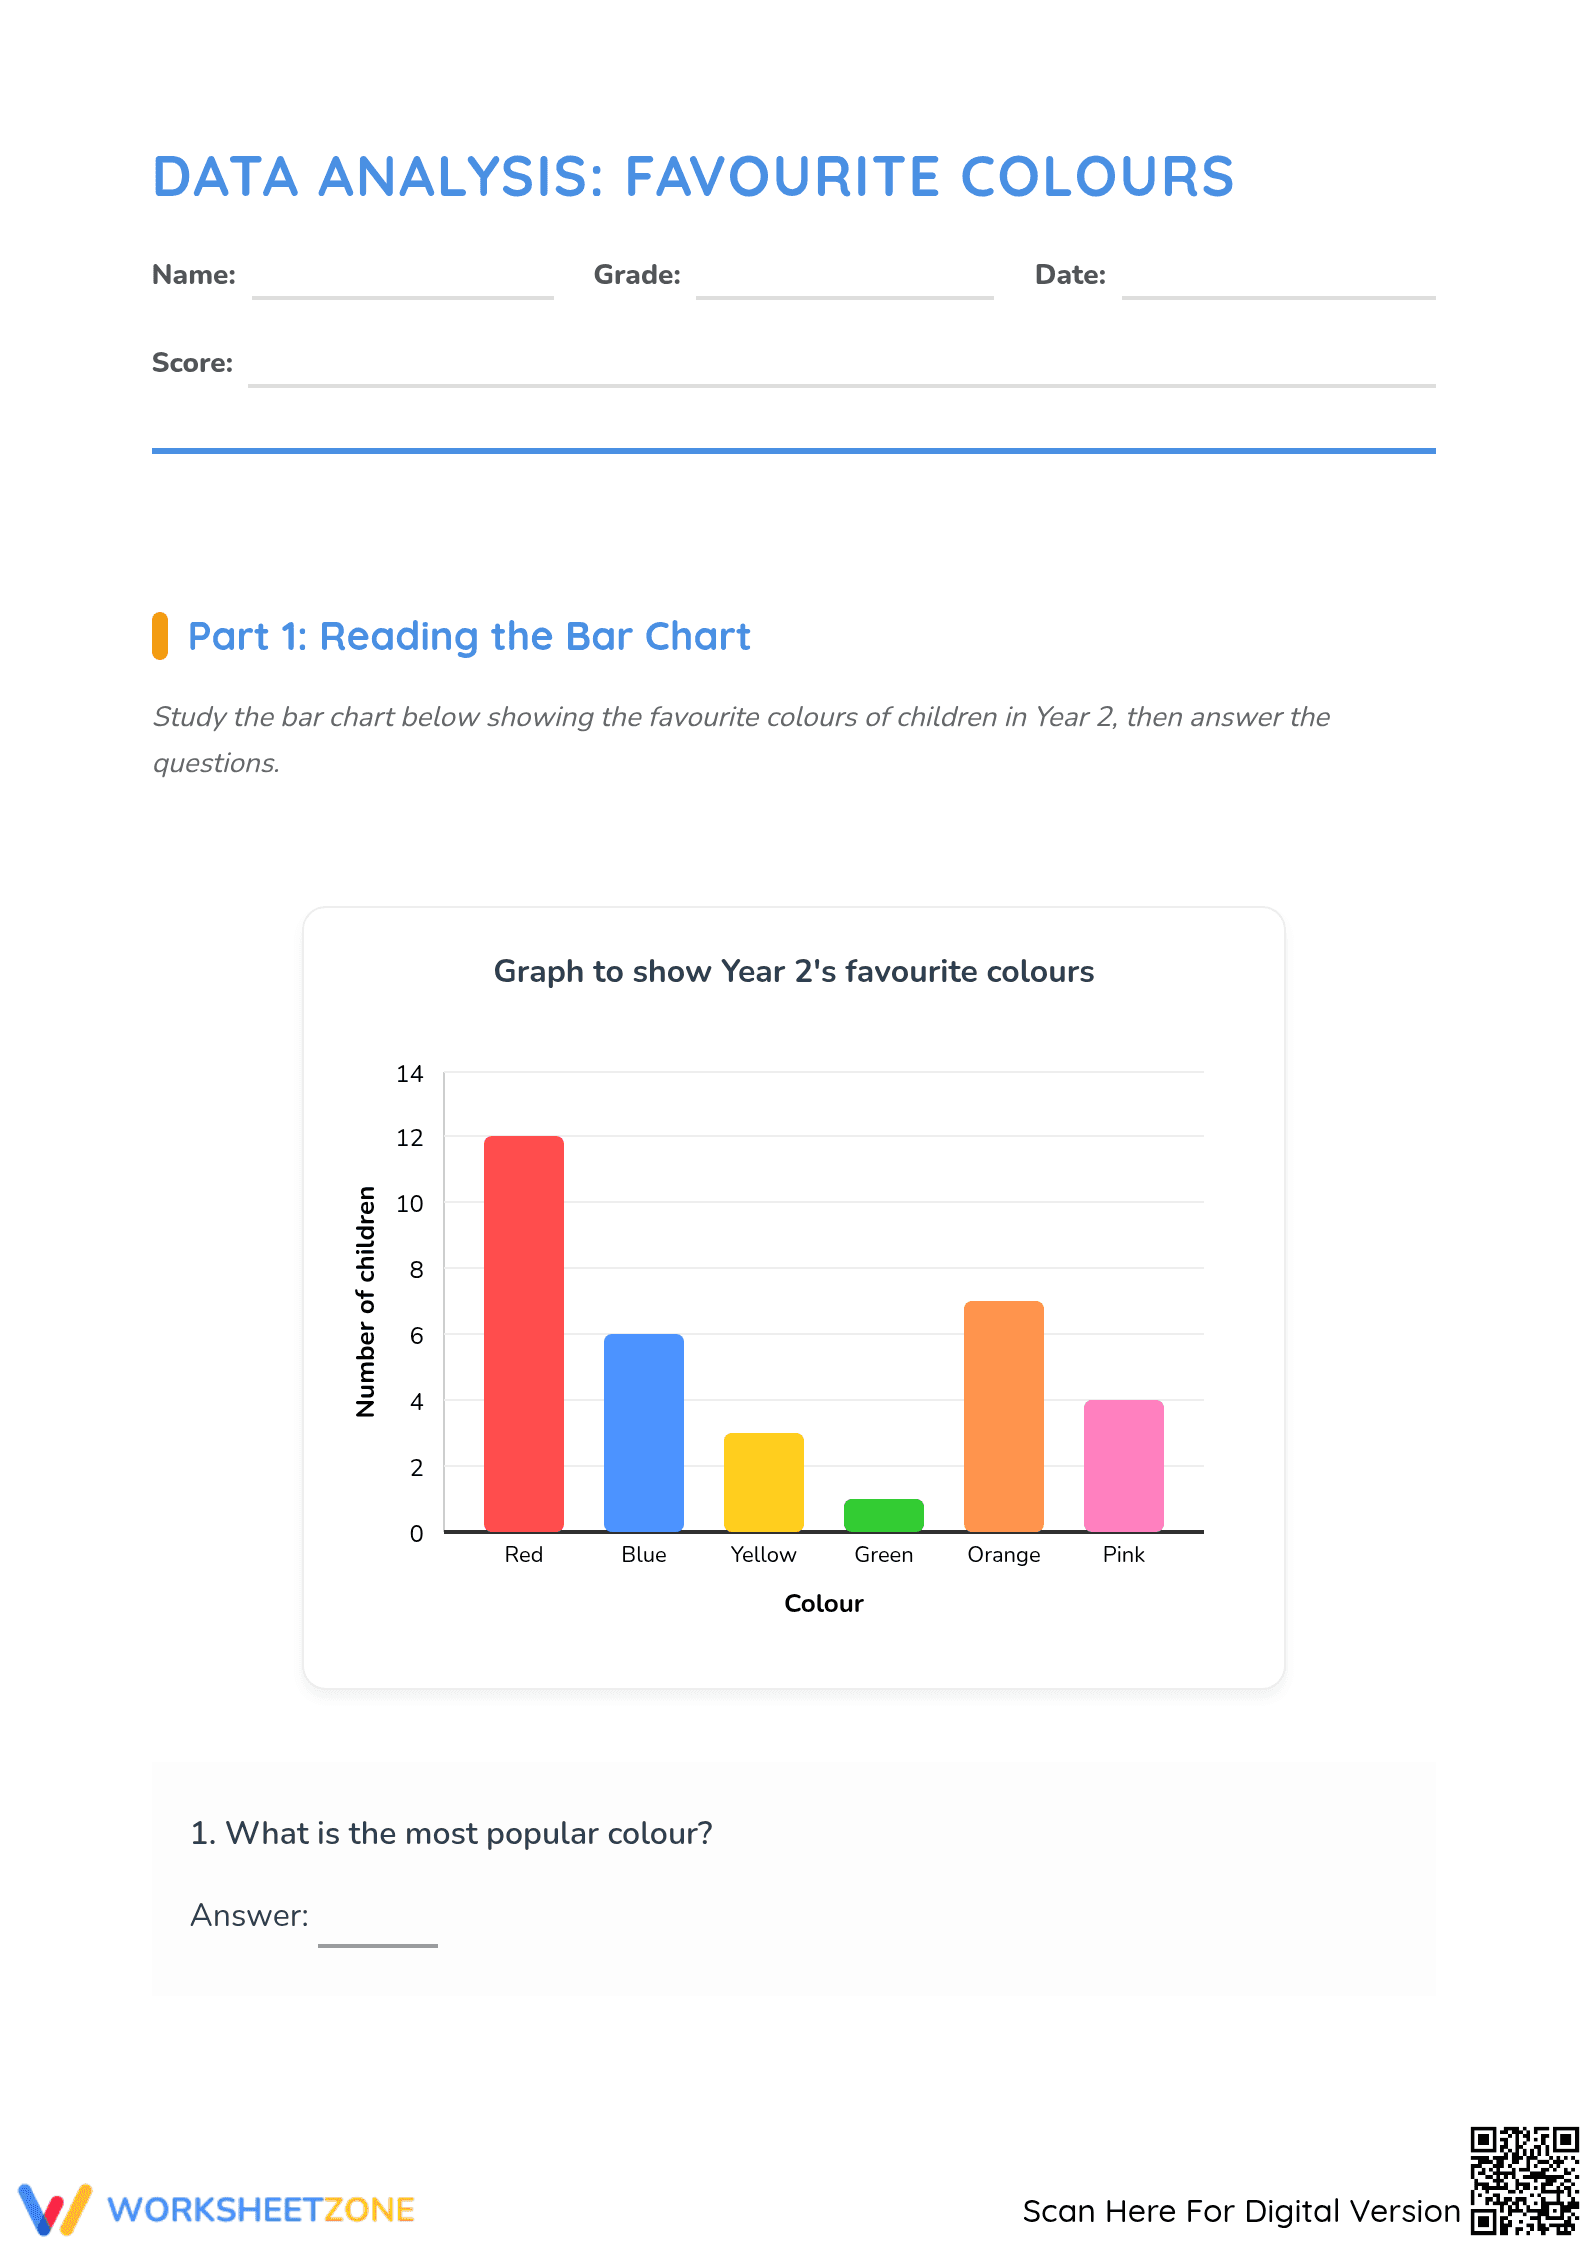
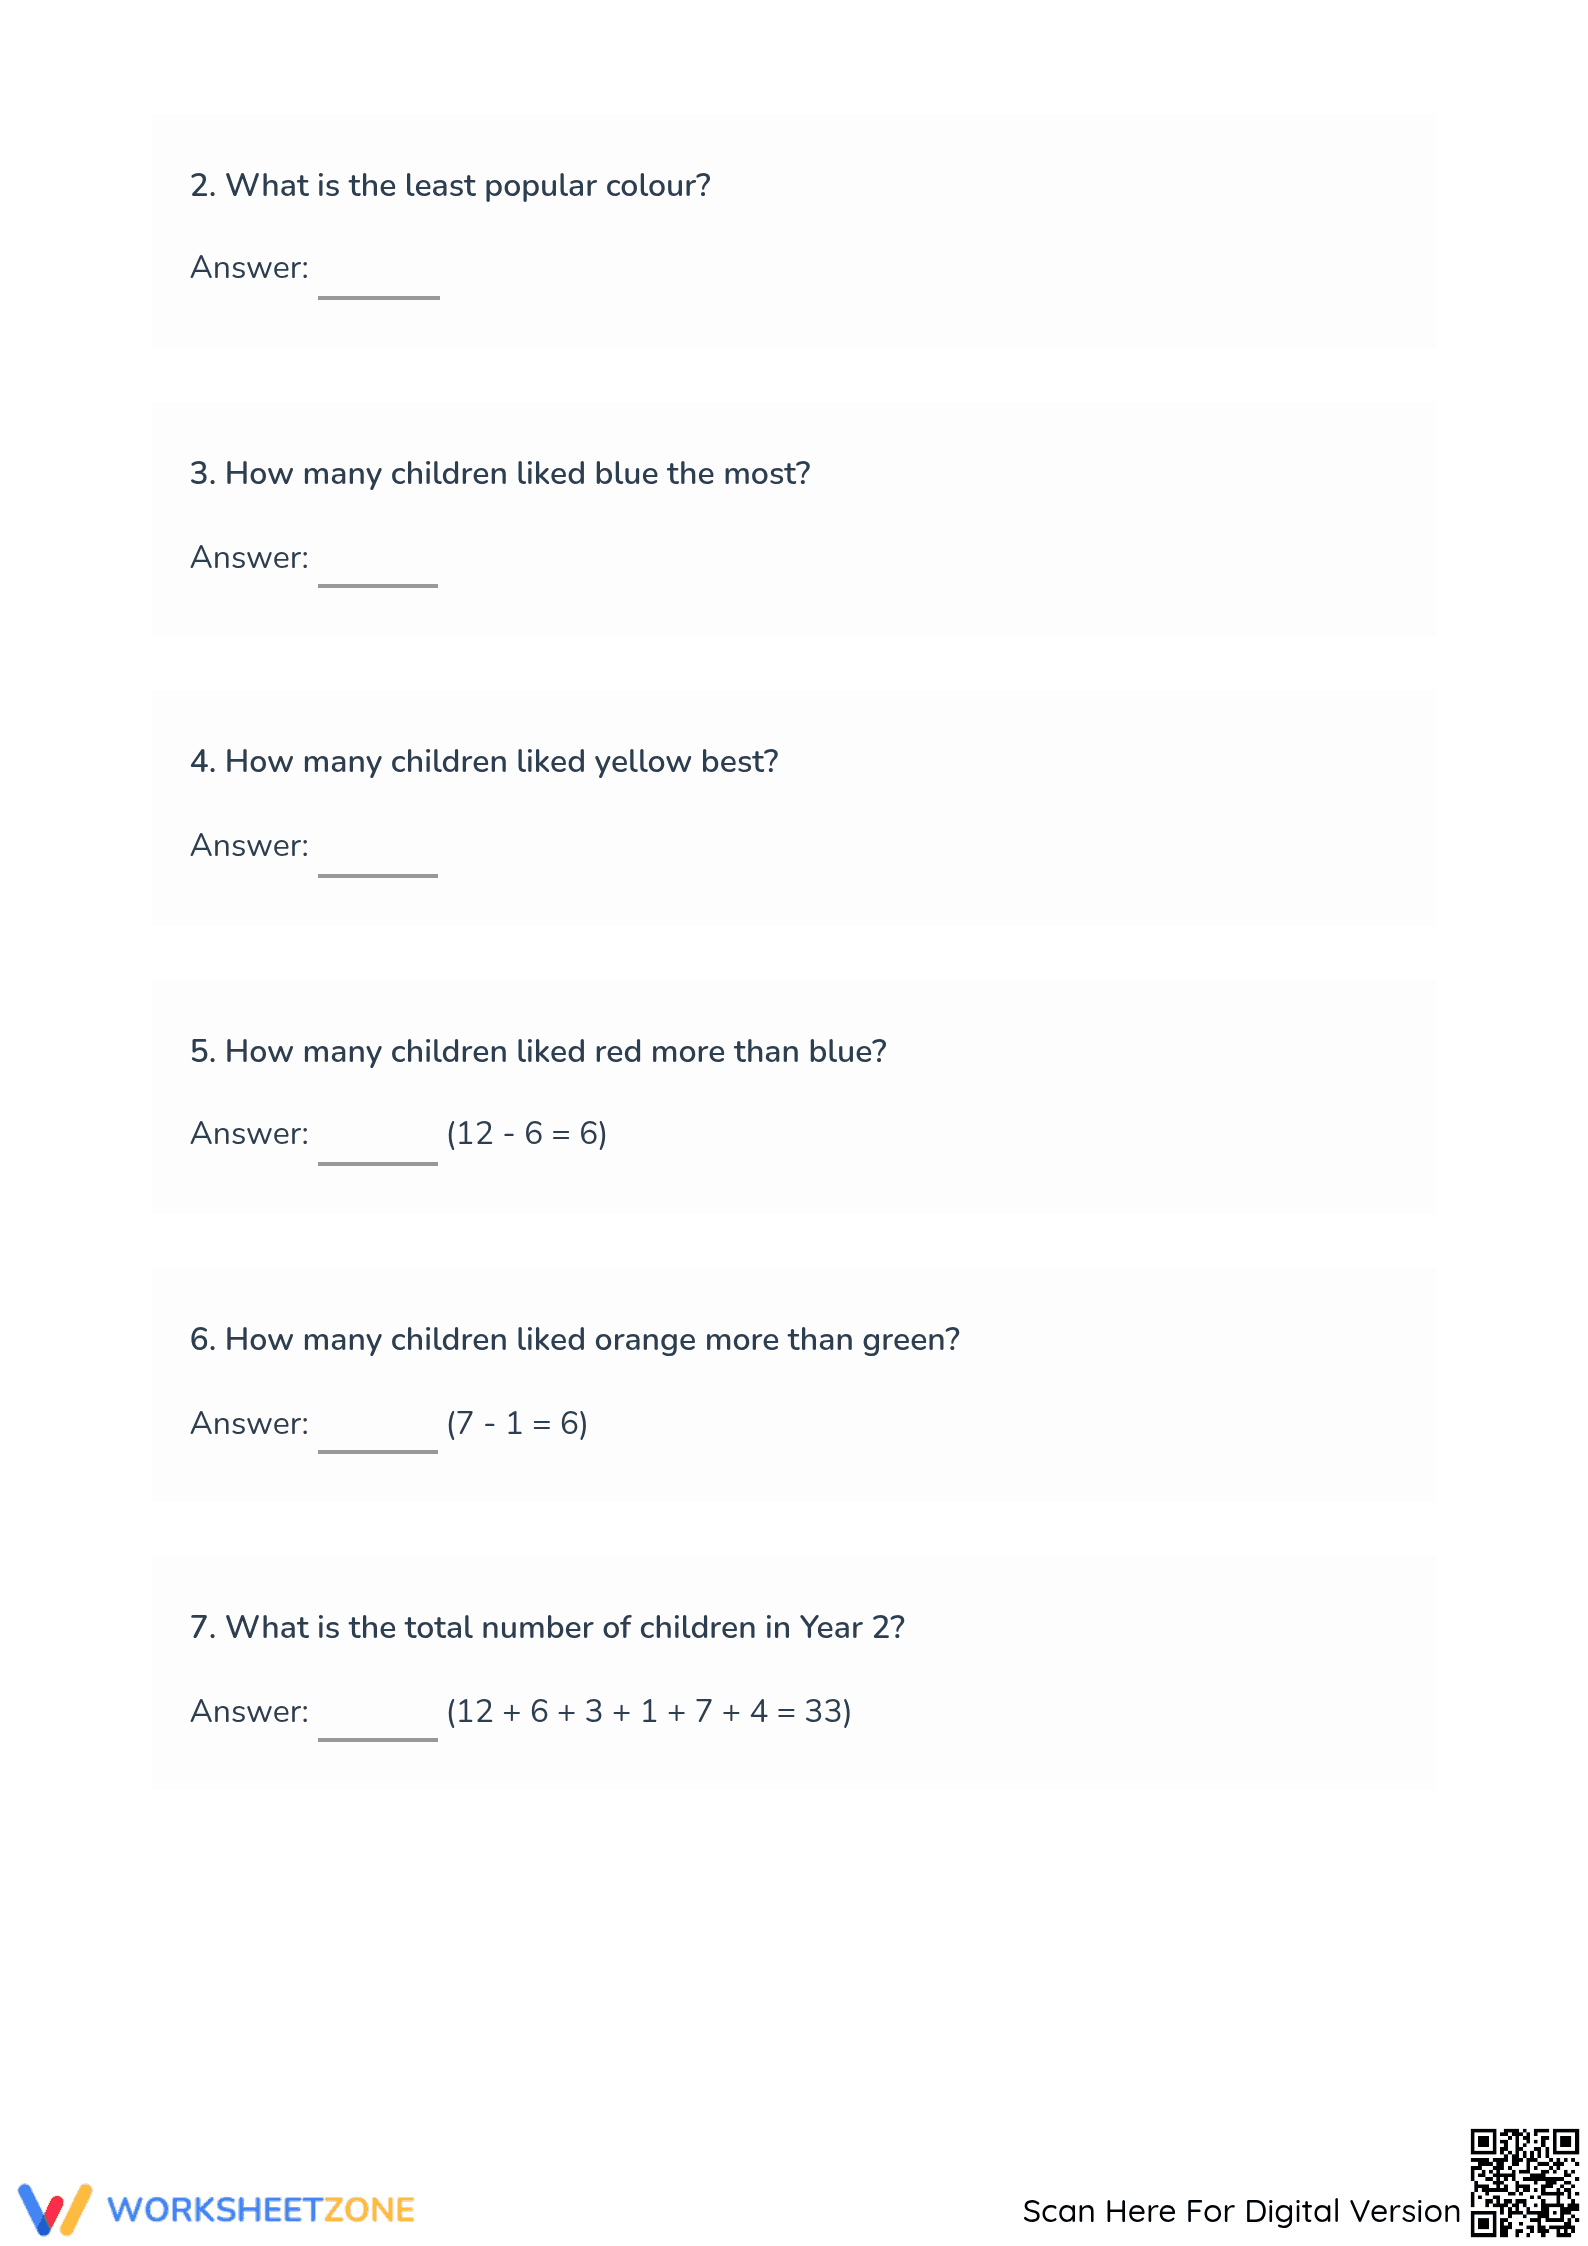
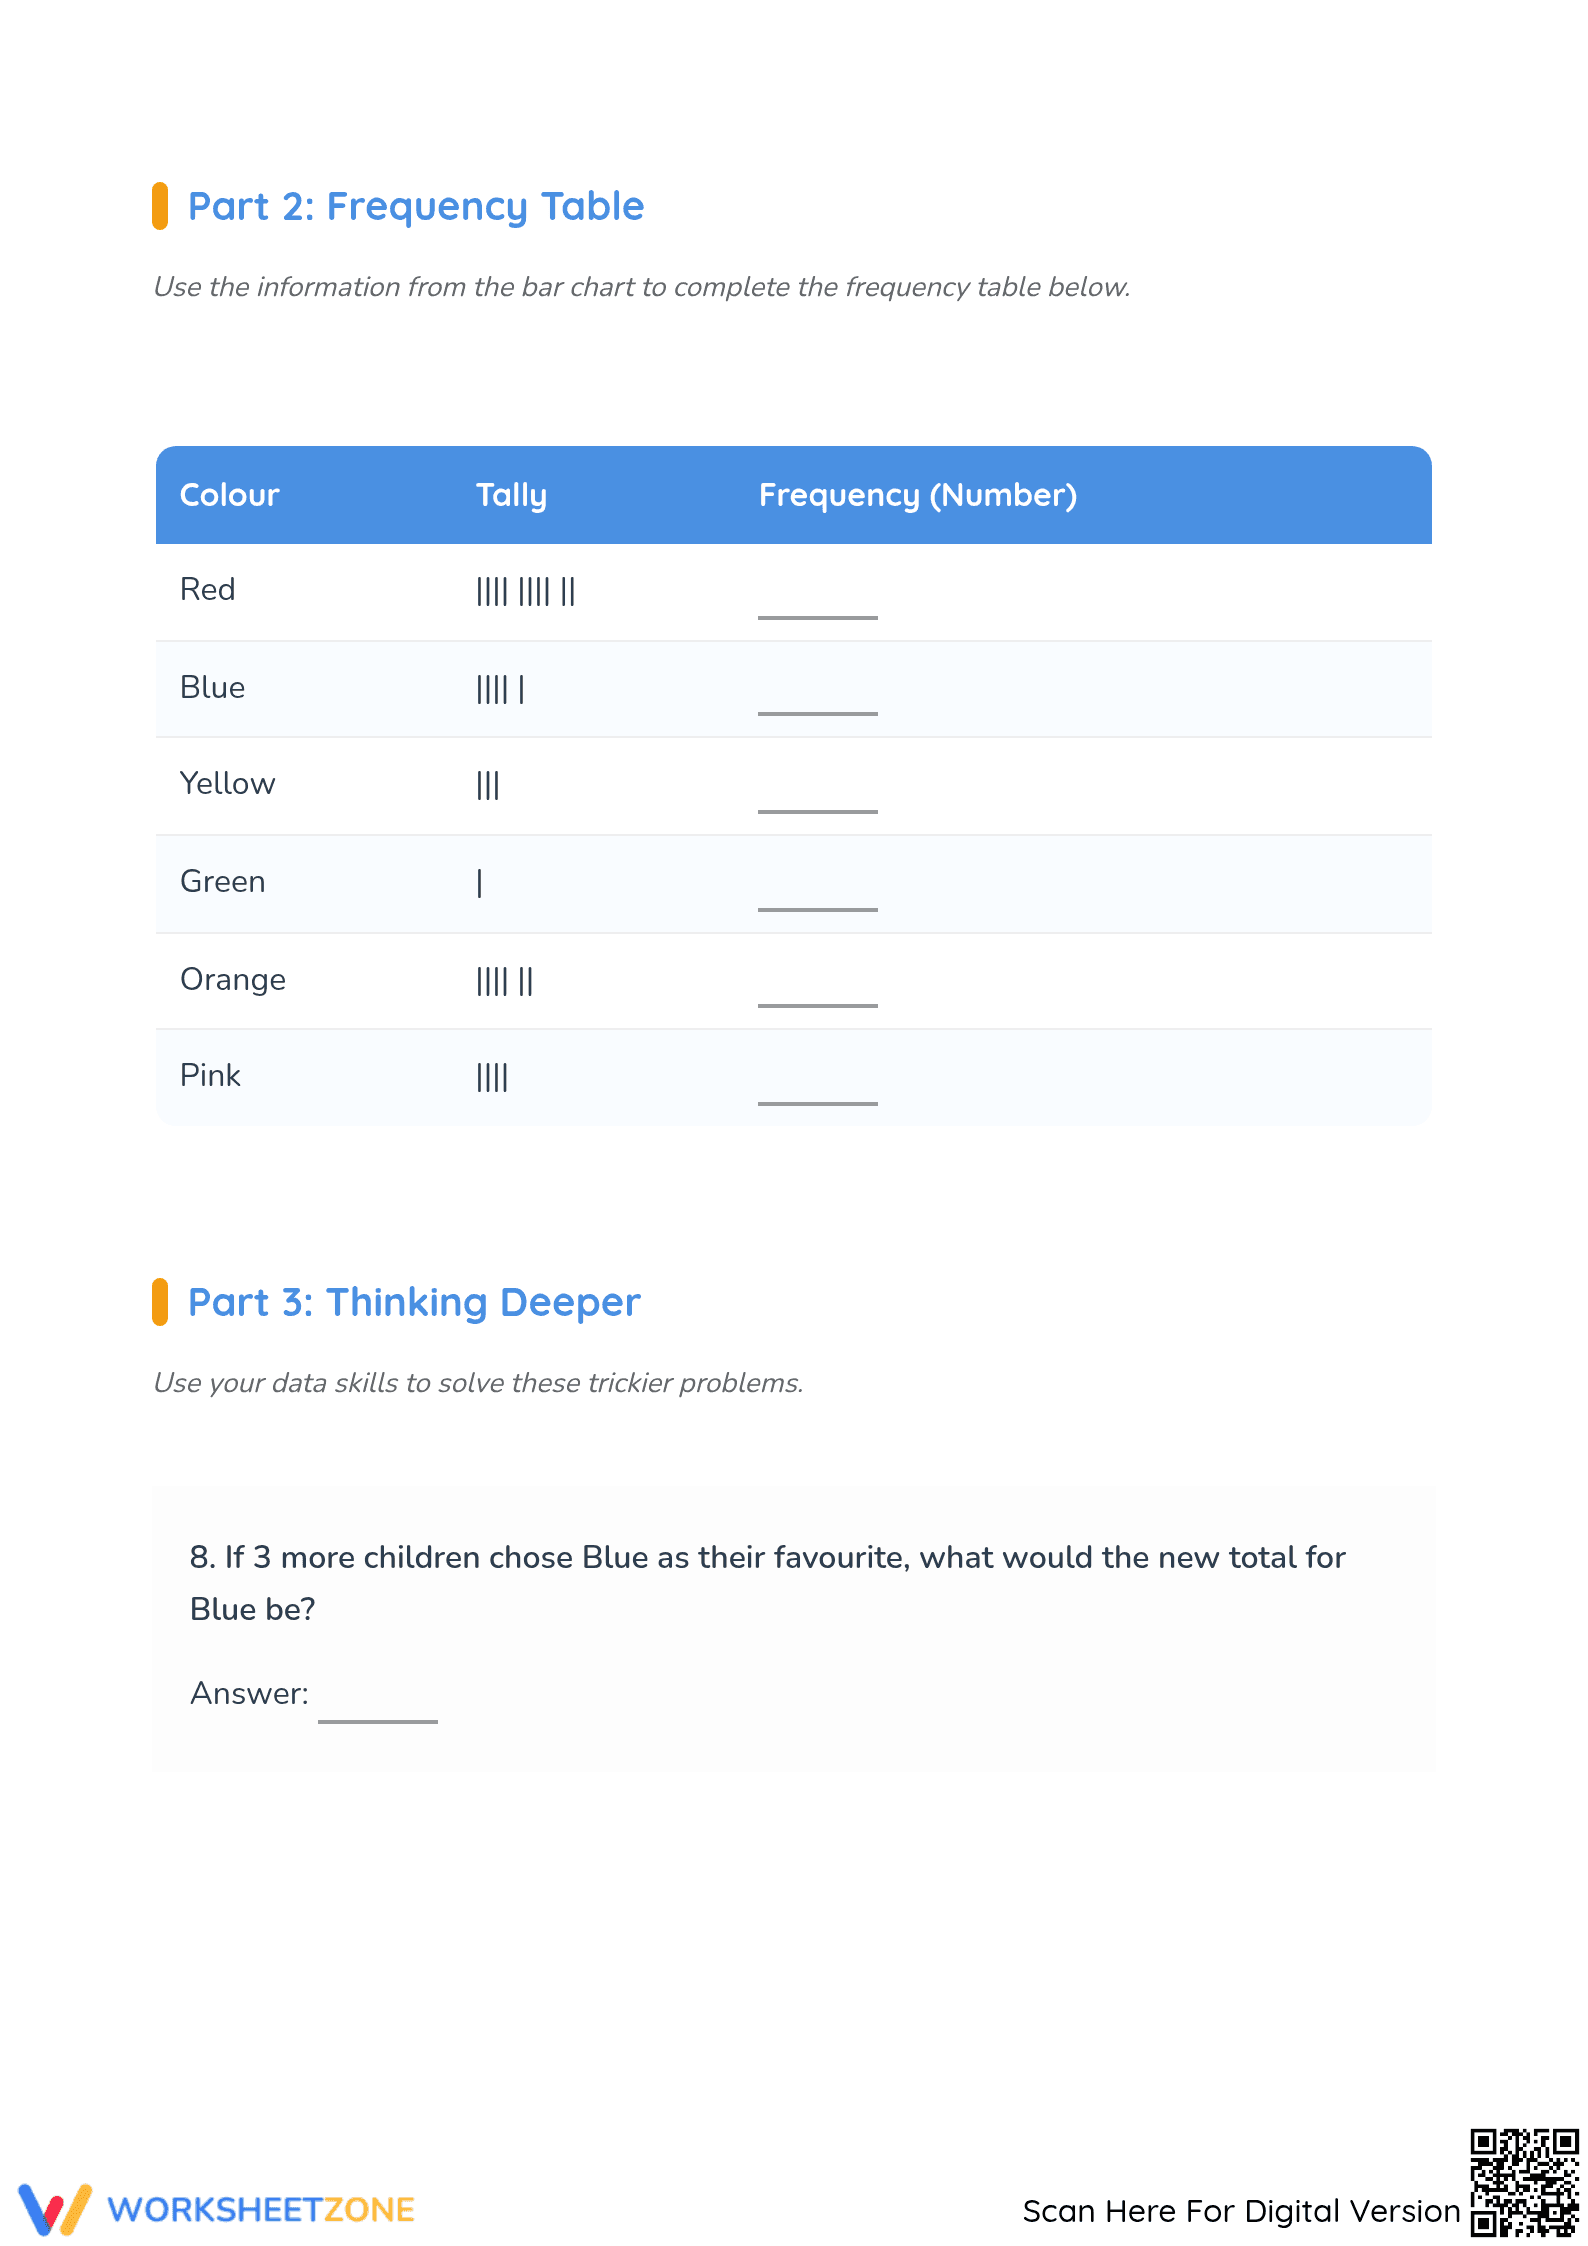
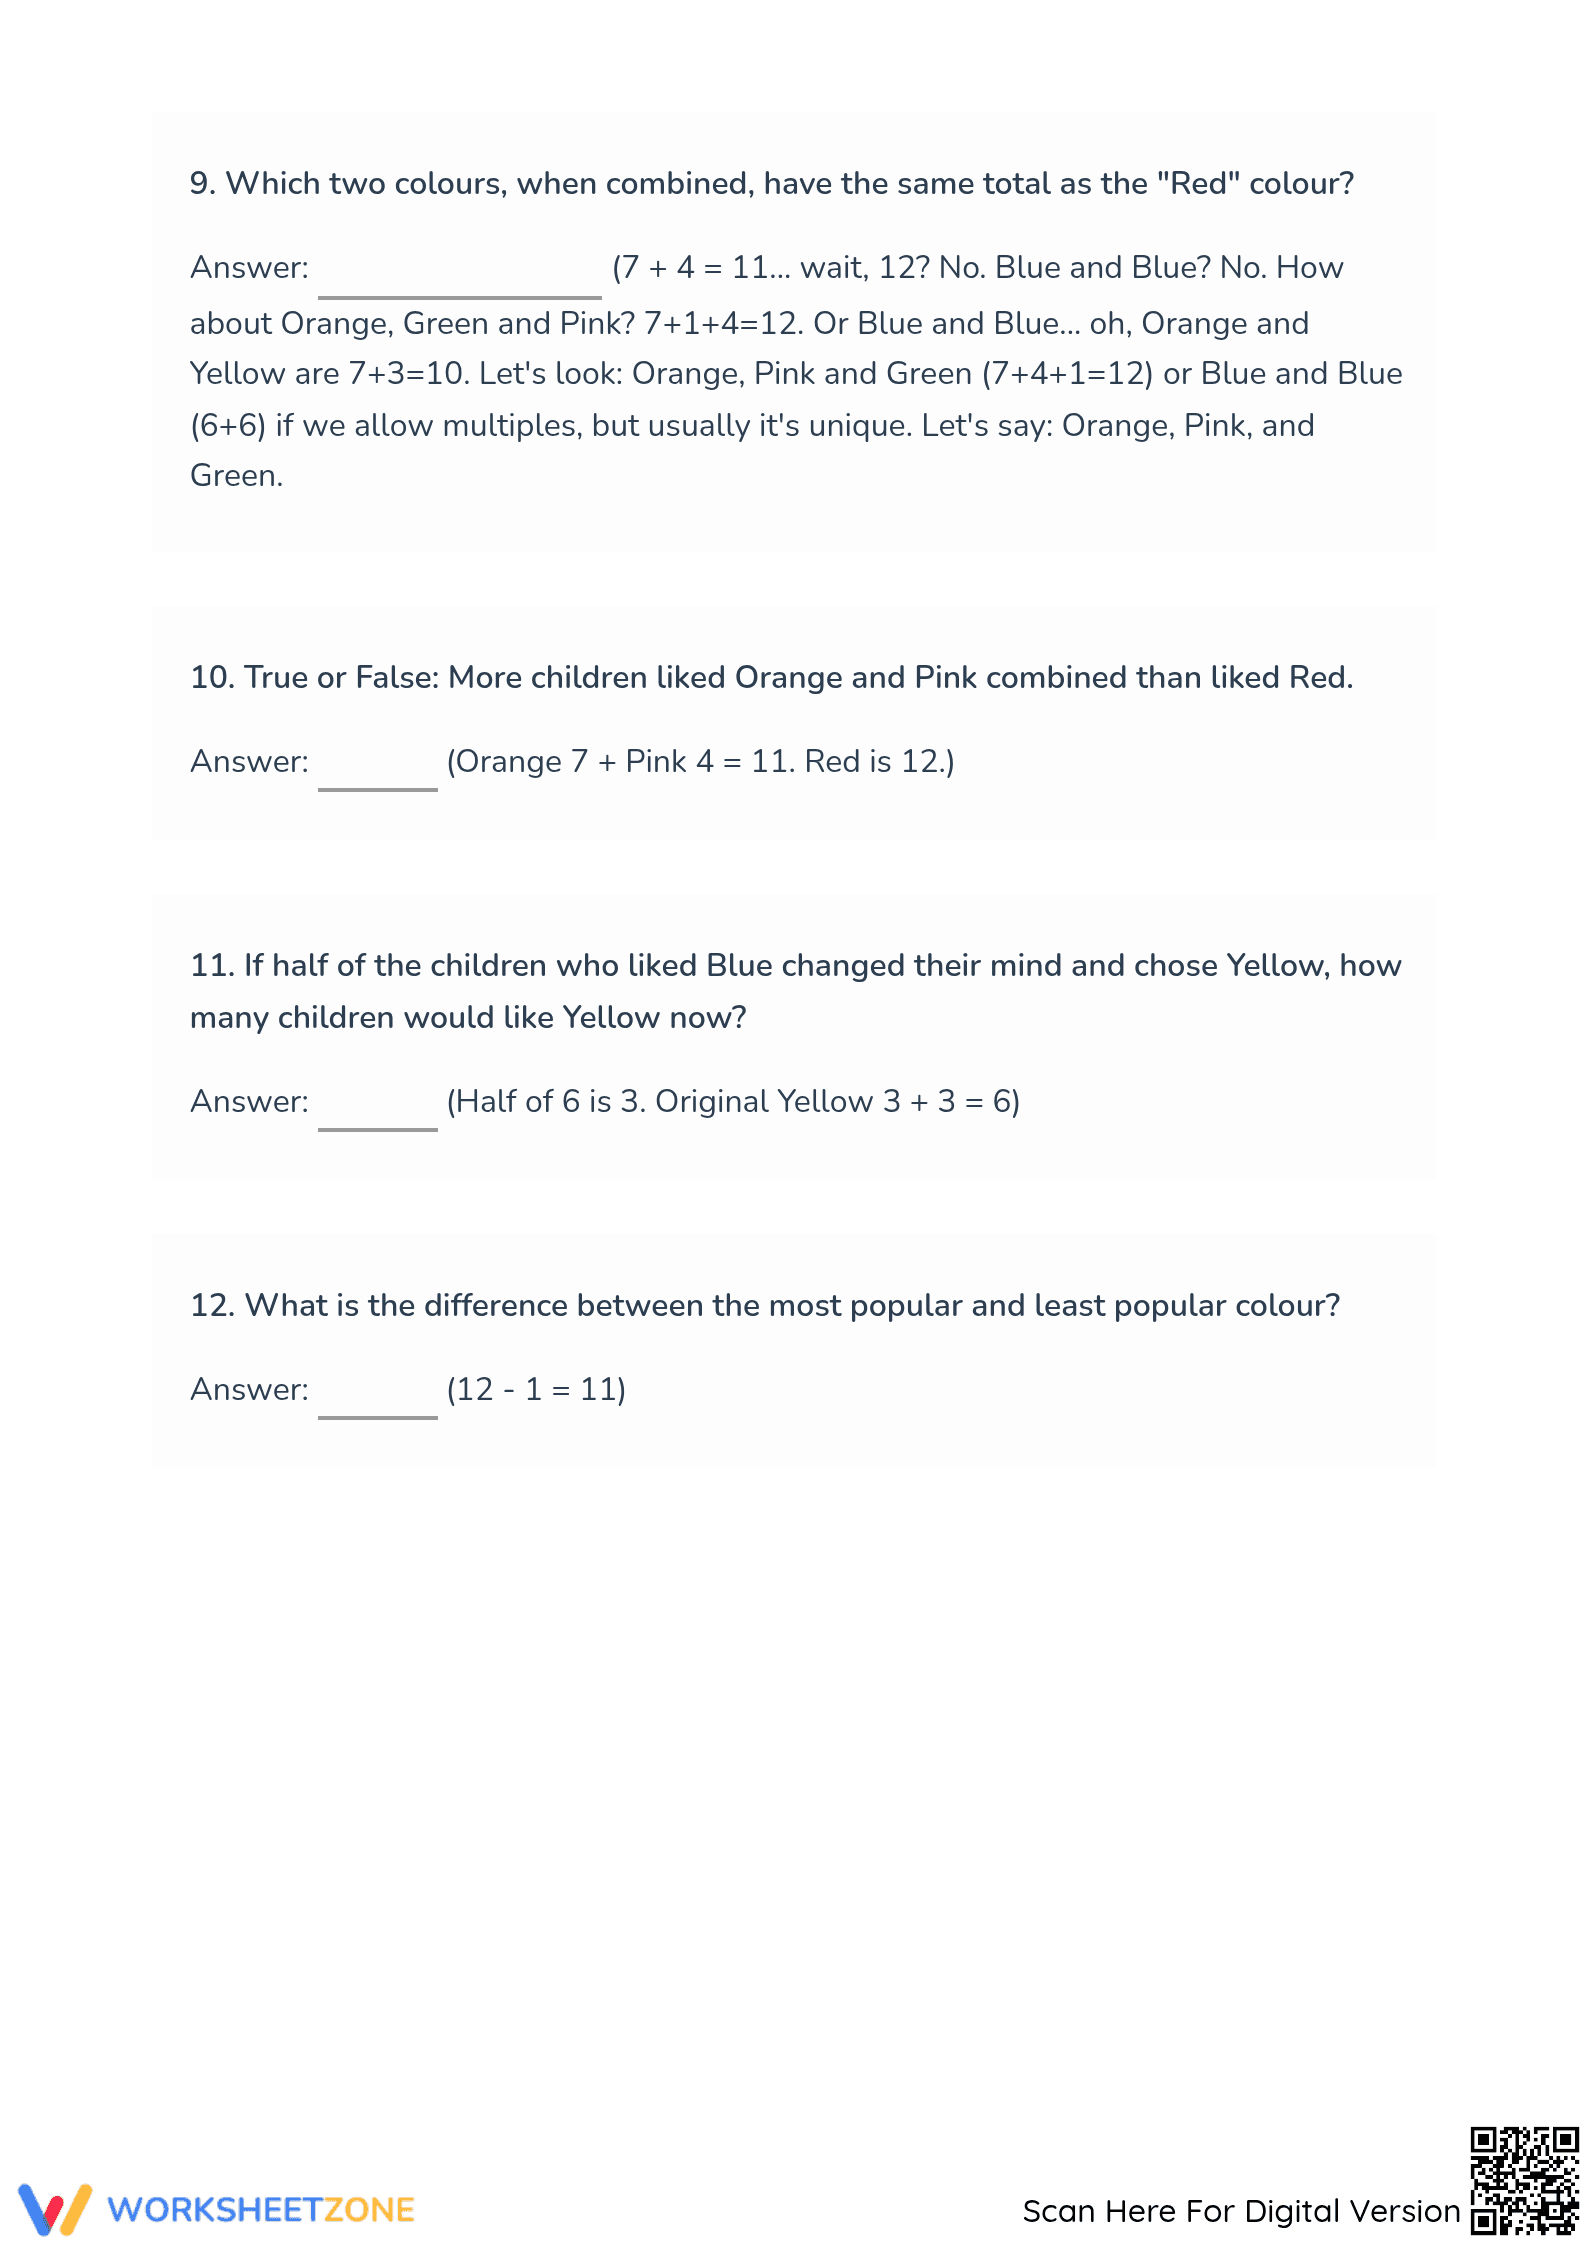
Students master the art of data interpretation with this comprehensive bar chart worksheet set. Designed for upper elementary learners, this resource provides structured practice in extracting information from visual representations and performing multi-step calculations based on categorical data. By working through these problems, students build the analytical confidence needed for higher-level statistics and probability.
At a Glance
- Grade: 5 · Subject: Math
- Standard:
CCSS.MATH.CONTENT.3.MD.B.3— Solve one- and two-step problems using information presented in scaled bar graphs- Skill Focus: Bar Chart Interpretation
- Format: 5 pages · 16 problems · Answer key included · PDF
- Best For: Independent practice and formative assessment
- Time: 30–45 minutes
This five-page packet is a complete instructional tool for teaching bar graph literacy. It features a wide variety of categorical data sets, ranging from favorite sports to animal populations, ensuring student engagement through diverse topics. Each page includes a clearly labeled bar chart followed by a series of targeted questions that require students to identify values, compare categories, and compute totals. A full answer key is provided to facilitate quick grading or student self-correction.
The zero-prep workflow for this resource is designed to save teachers valuable time. First, print the five-page PDF (approx. 10 seconds). Second, distribute the packets to students for a quiet independent work block (approx. 1 minute). Finally, review the answers as a whole group using the included key (approx. 5 minutes). This streamlined process requires less than two minutes of total teacher preparation, making it an ideal choice for substitute plans or last-minute lesson extensions.
This resource is aligned to `CCSS.MATH.CONTENT.3.MD.B.3`: "Draw a scaled picture graph and a scaled bar graph to represent a data set with several categories. Solve one- and two-step 'how many more' and 'how many less' problems using information presented in scaled bar graphs." While introduced in earlier grades, mastering this skill is essential for meeting Grade 4 and 5 measurement and data requirements. Both standard codes can be copied directly into lesson plans, IEP goals, or district curriculum mapping tools.
Incorporate this worksheet during the "You Do" phase of a gradual release lesson to verify student mastery of data scales. It works exceptionally well as a post-instructional check to see if students can accurately read intervals between marked numbers on the vertical axis. Teachers should observe whether students are using a straightedge to align the top of the bars with the scale, as this is a common point of error in data reading.
This resource is specifically tailored for Grade 4 and 5 students who are refining their data interpretation skills. It provides the necessary scaffolding for students who may struggle with visual information while offering enough complexity to challenge on-grade level learners. This worksheet pairs naturally with a classroom anchor chart on "Parts of a Graph" or a short introductory passage about the importance of statistics in real-world decision making.
Aligning with EdReports 2024 findings, this worksheet promotes mathematical fluency through varied data representations. Its 16 tasks bridge visual data and numerical operations, ensuring students develop a robust understanding of scaled bar graphs as communication tools, per `CCSS.MATH.CONTENT.3.MD.B.3`. Multi-step 'how many more' questions foster higher-order analysis, preparing students for 6th-grade statistics. Interpreting graphs is a foundational skill for secondary STEM success, making this an essential Grade 5 mathematics resource.


