


0
Views
0
Downloads
0.0
0
Save
0 Likes
Analyzing Bivariate Categorical Data Using Favorite Colors
0 Views
0 Downloads
Paste this activity's link or code into your existing LMS (Google Classroom, Canvas, Teams, Schoology, Moodle, etc.).
Students can open and work on the activity right away, with no student login required.
You'll still be able to track student progress and results from your teacher account.
Information
Description
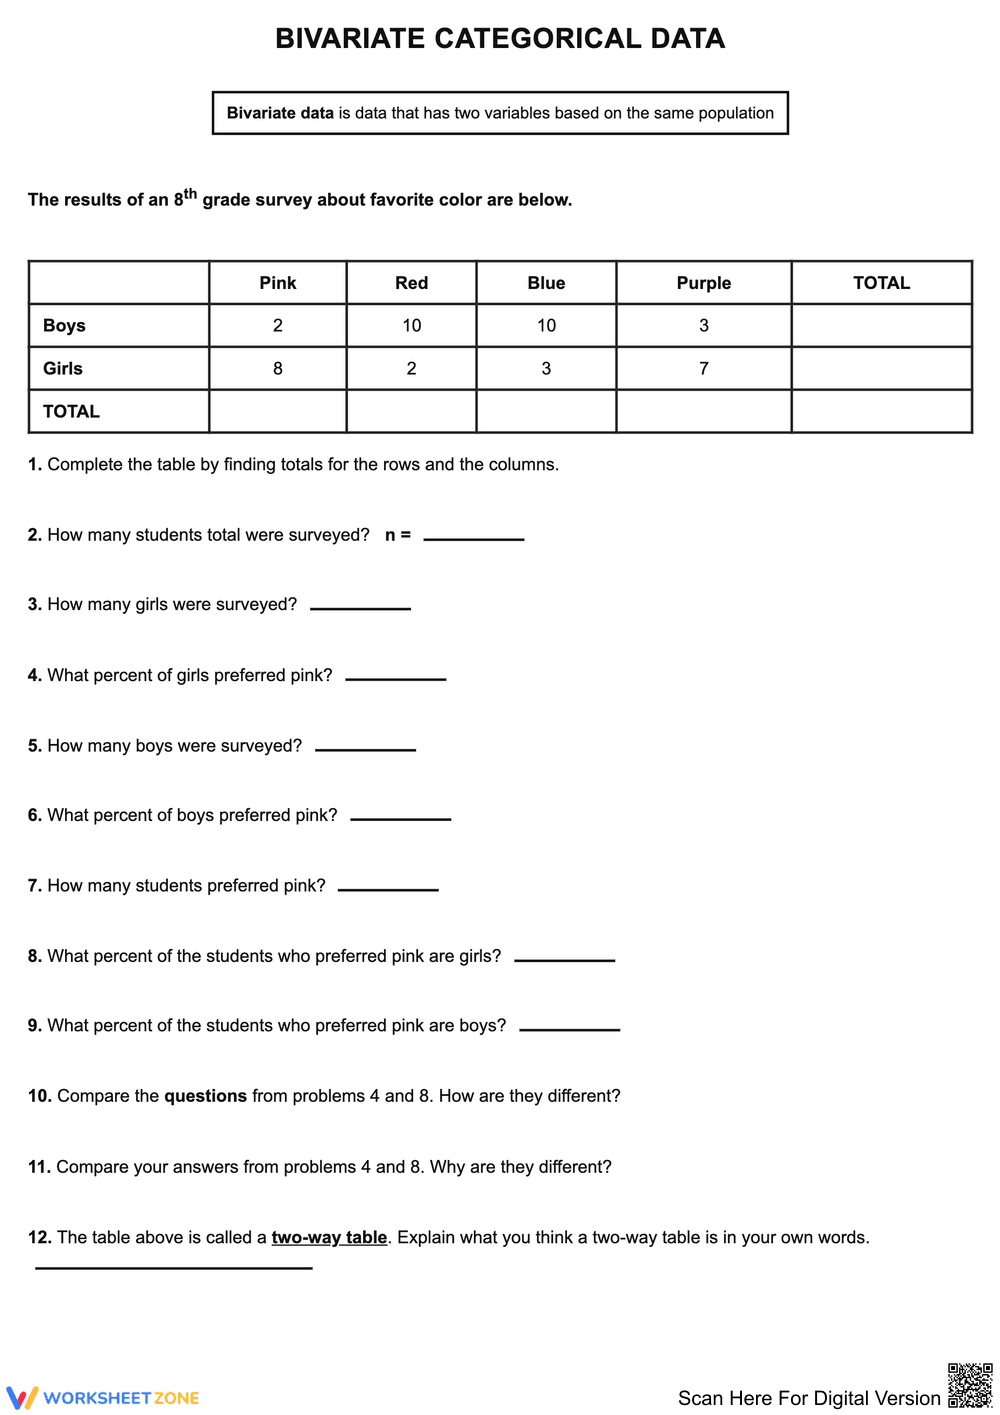
What It Is:
This worksheet focuses on bivariate categorical data through a survey about 8th graders' favorite colors. It includes tables, calculations, and questions that engage students in data analysis skills.
Why Use It:
This practical activity supports development of mathematical reasoning and critical thinking by analyzing real-world data.
How to Use It:
• Distribute the worksheet to students.
• Guide them in completing the data table and answering questions.
• Discuss the implications of the survey results in class.
Grade Suitability:
Best for Grade 9.
• Younger kids focus on basic data gathering.
• Older students delve into deeper analysis of statistical concepts.
Target Users:
This worksheet is perfect for teachers and students looking to enhance their understanding of statistical data.