


Views
Downloads


Grade 2 Pie Chart Worksheet — Printable No-Prep Math
Paste this activity's link or code into your existing LMS (Google Classroom, Canvas, Teams, Schoology, Moodle, etc.).
Students can open and work on the activity right away, with no student login required.
You'll still be able to track student progress and results from your teacher account.
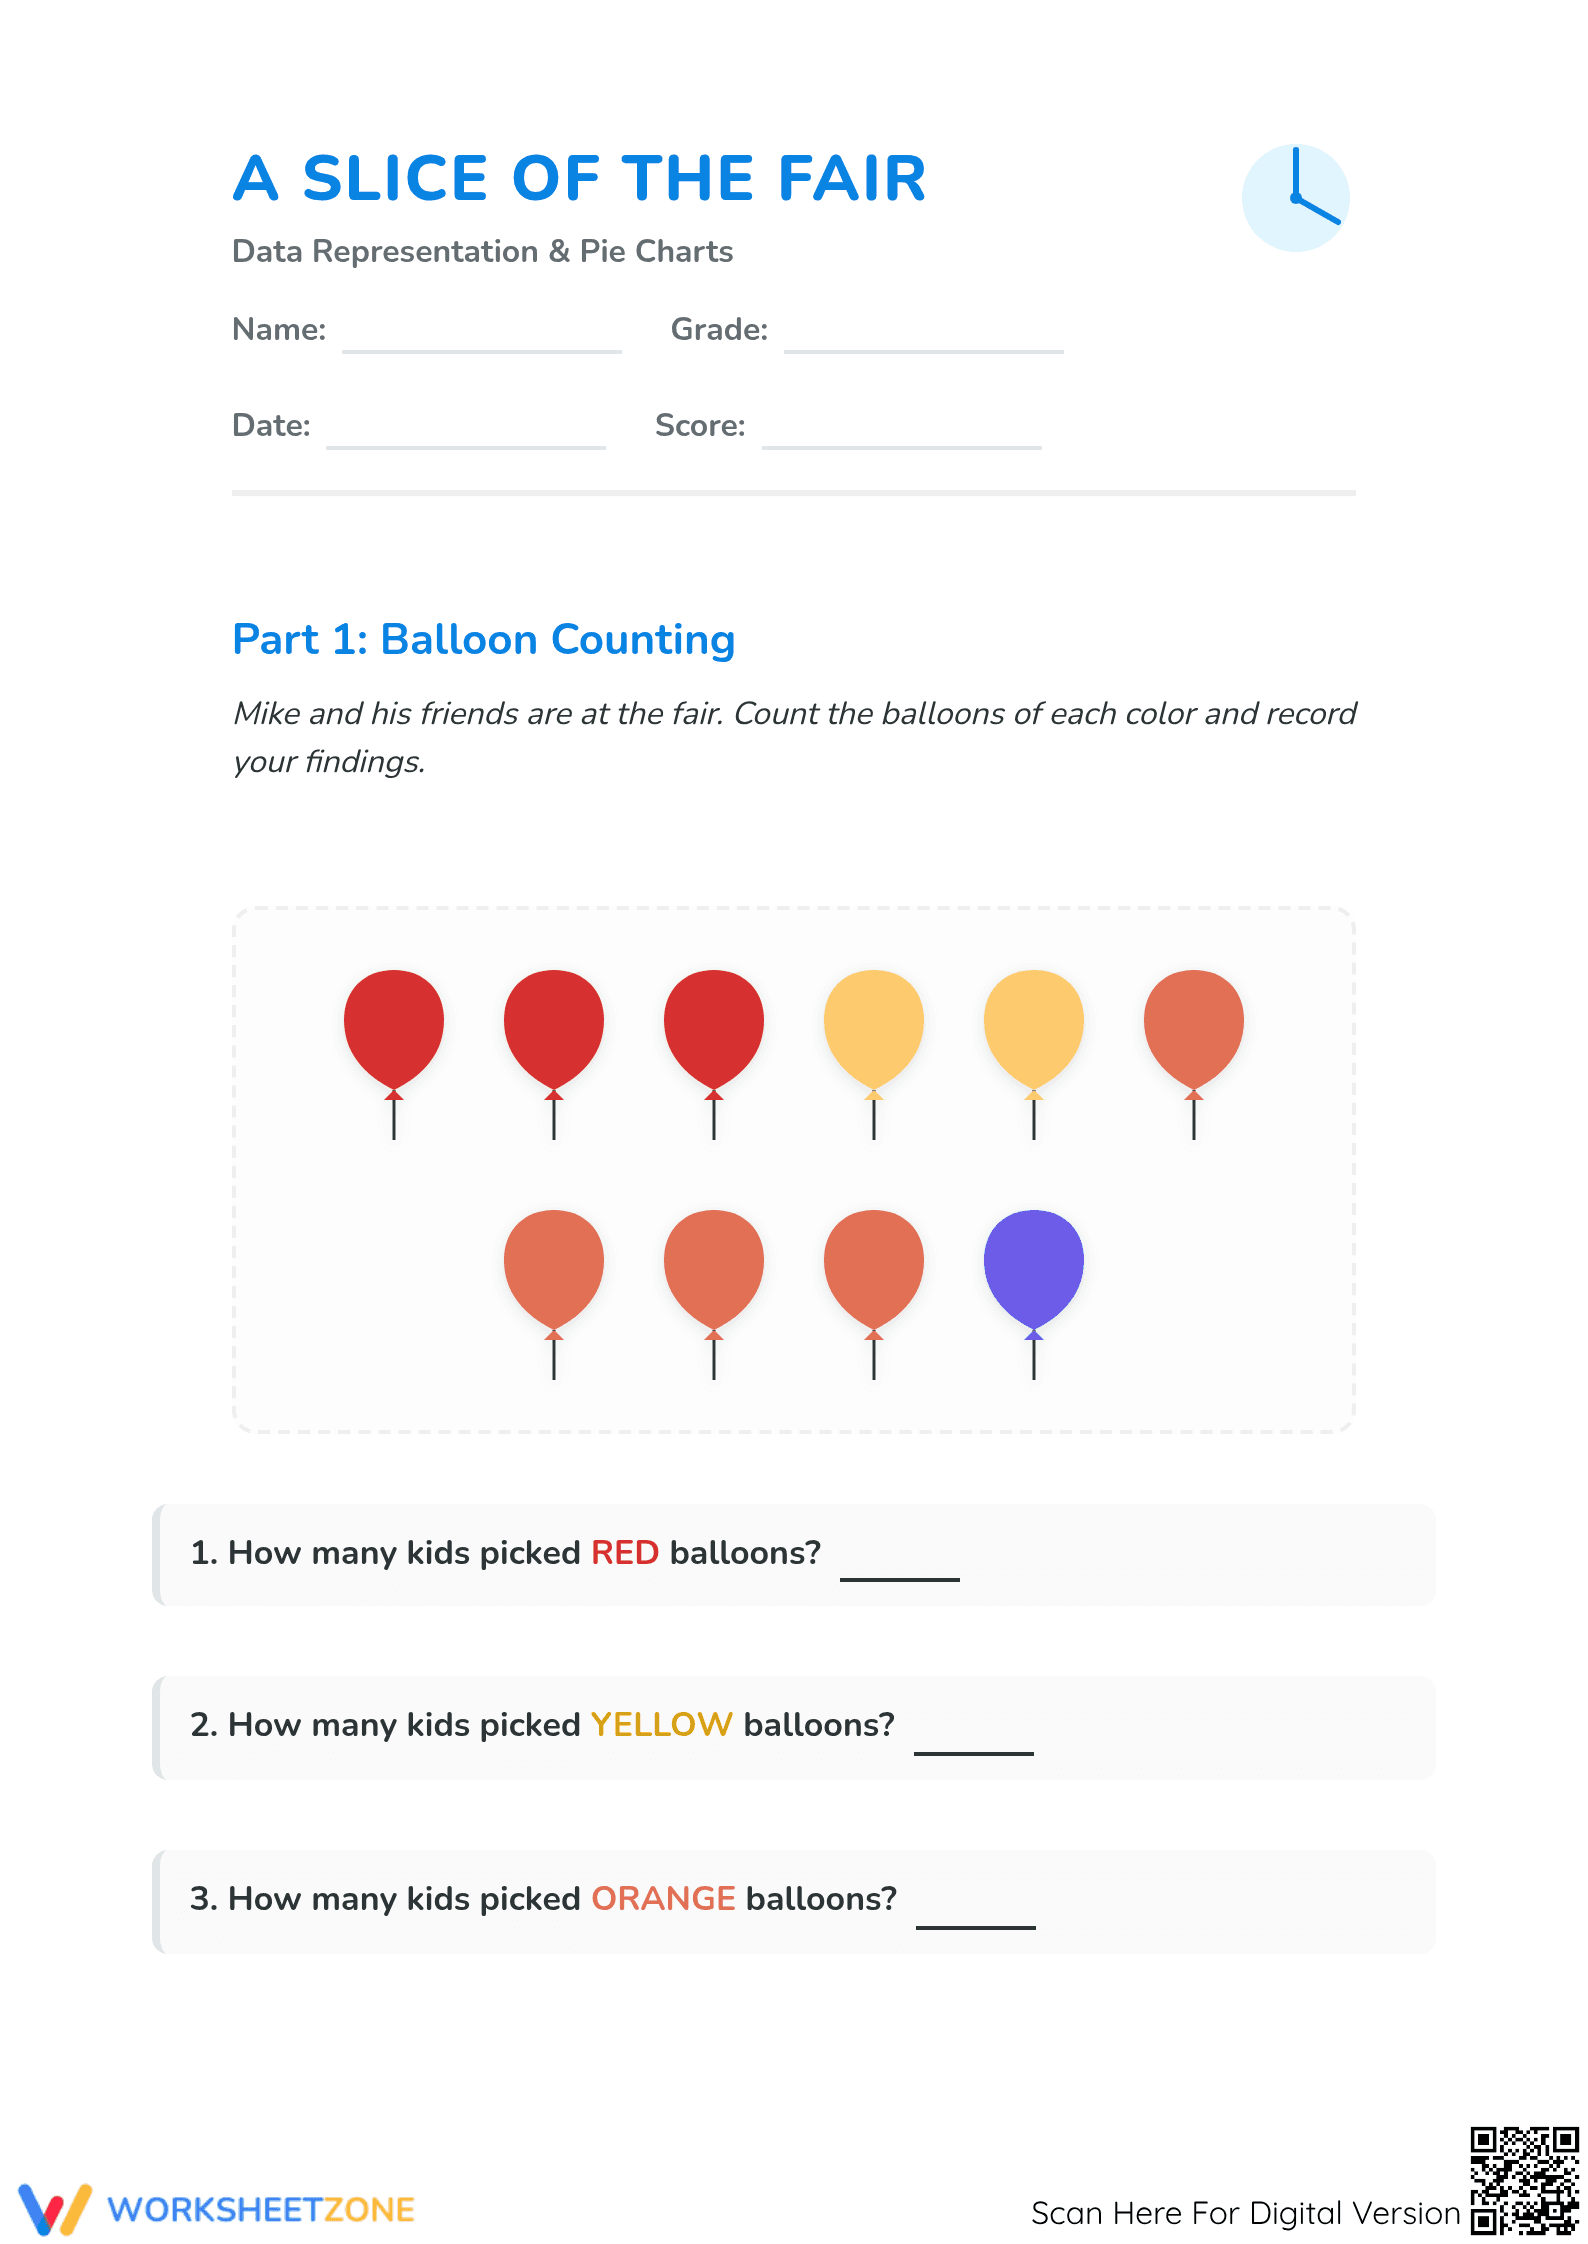
This essential Grade 2 graphing worksheet introduces young learners to the logic of data visualization through a fun, fair-themed scenario. Students count colored balloons from a provided set, translate those raw numbers into a 10-slice circular graph, and solve analytical comparison problems to build foundational mathematical literacy.
At a Glance
- Grade: 2 · Subject: Math
- Standard:
CCSS.MATH.CONTENT.2.MD.D.10— Draw graphs to represent data and solve simple comparison problems- Skill Focus: Data representation and pie chart interpretation
- Format: 3 pages · 11 problems · Answer key included · PDF
- Best For: Independent practice or introductory graphing lesson
- Time: 20–30 minutes
This 3-page packet progresses from counting 10 balloons across four color categories on page one, to mapping data onto a 10-slice pie chart template on page two. Page three concludes with multi-step analysis questions and a bonus tally mark challenge, reinforcing diverse data representation.
Zero-Prep Workflow
- Step 1: Print the three-page PDF document for your entire class (less than 30 seconds).
- Step 2: Distribute the worksheets to students; no additional manipulatives or teacher modeling is required as the instructions are self-contained.
- Step 3: Review student work using the provided answer key during a whole-class check or for quick individual grading.
Total teacher preparation time is under one minute, making this resource an ideal choice for substitute teacher plans or emergency math curriculum filler.
Standards Alignment
Primary Standard: CCSS.MATH.CONTENT.2.MD.D.10 — "Draw a picture graph and a bar graph (with single-unit scale) to represent a data set with up to four categories. Solve simple put-together, take-apart, and compare problems using information presented in a graph." Although using a pie chart, its 1:1 unit scale aligns with 2nd-grade graphing expectations. This standard code is ready for lesson plans, IEP goals, or curriculum mapping.
How to Use It
Use this worksheet as a post-instruction formative assessment to verify if students can accurately transfer counted data into a visual model. During the lesson, observe if students correctly color exactly four orange slices to match the four orange balloons in the prompt; this indicates a solid grasp of 1:1 correspondence in data mapping. The expected completion time for the full three-page packet is approximately 25 minutes for most elementary students.
Who It's For
This resource is specifically designed for Grade 2 students but serves as an excellent extension activity for advanced Grade 1 learners. It works exceptionally well when paired with a "Graphing at the Fair" anchor chart or as a follow-up to a concrete counting activity using physical tokens or classroom objects. The visual nature of the pie chart makes it accessible for English Language Learners (ELL) practicing math vocabulary.
This worksheet fosters early mathematical literacy, guiding students through the 'count, model, analyze' cycle essential for data interpretation. It builds representational fluency, moving students between data formats—a key skill for future statistical success—while reducing cognitive load with familiar contexts.