


1 / 8
0
Views
0
Downloads


0.0
0
Save
0 Likes
Graphing Absolute Value Functions Worksheet
0 Views
0 Downloads
Paste this activity's link or code into your existing LMS (Google Classroom, Canvas, Teams, Schoology, Moodle, etc.).
Students can open and work on the activity right away, with no student login required.
You'll still be able to track student progress and results from your teacher account.
Information
Description
What It Is:
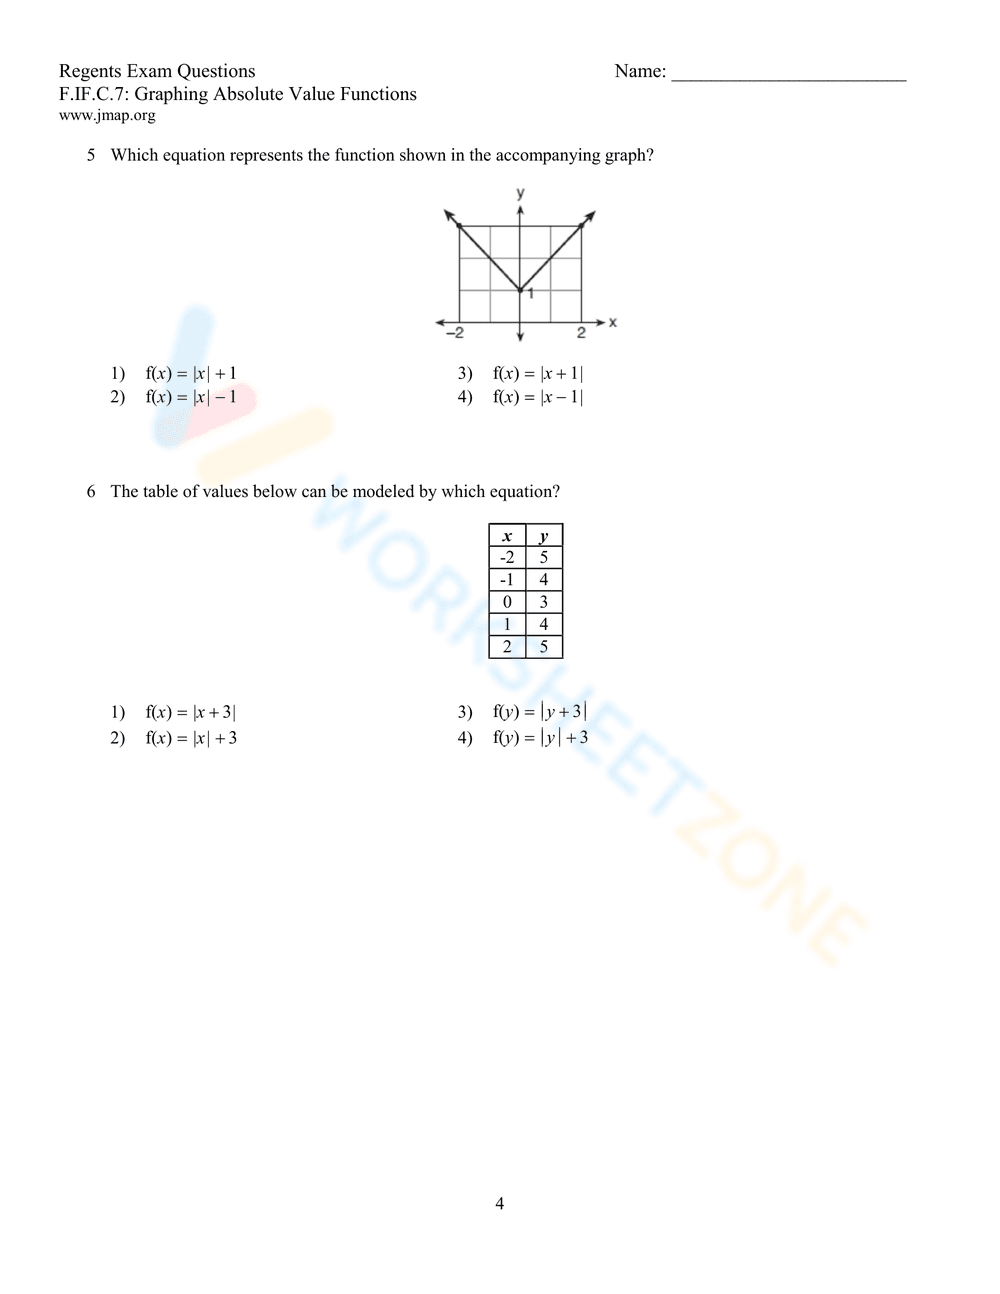
This is a math worksheet featuring a Regents Exam question focused on graphing absolute value functions. The worksheet presents a graph of a linear function, f(x), and asks the student to identify which of four provided graphs best represents the absolute value of that function, |f(x)|. The student must choose from four different graph options labeled 1 through 4.
Grade Level Suitability:
This worksheet is most suitable for high school students, specifically grades 9-12, studying algebra or pre-calculus. The content requires an understanding of functions, graphing, and the concept of absolute value, which are typically covered in these grades.
Why Use It:
This worksheet helps students practice identifying the graphical transformation that occurs when taking the absolute value of a function. It reinforces the concept that the absolute value function reflects any portion of the original graph that lies below the x-axis (negative y-values) above the x-axis, creating a V-shaped graph.
How to Use It:
Students should first analyze the original graph, noting its slope and intercepts. Then, they should consider how the absolute value function will transform the graph, specifically focusing on how negative y-values will become positive. Finally, they should compare the transformed graph to the four options provided and select the best match.
Target Users:
This worksheet is targeted towards high school students preparing for exams, particularly the Regents Exam, that cover graphing absolute value functions. It is also useful for teachers looking for practice problems to reinforce this concept in their algebra or pre-calculus classes.