


0
Views
0
Downloads
0.0
0
Save
0 Likes
Geologic Time Scale Percentages Worksheet
0 Views
0 Downloads
Paste this activity's link or code into your existing LMS (Google Classroom, Canvas, Teams, Schoology, Moodle, etc.).
Students can open and work on the activity right away, with no student login required.
You'll still be able to track student progress and results from your teacher account.
Information
Description
What It Is:
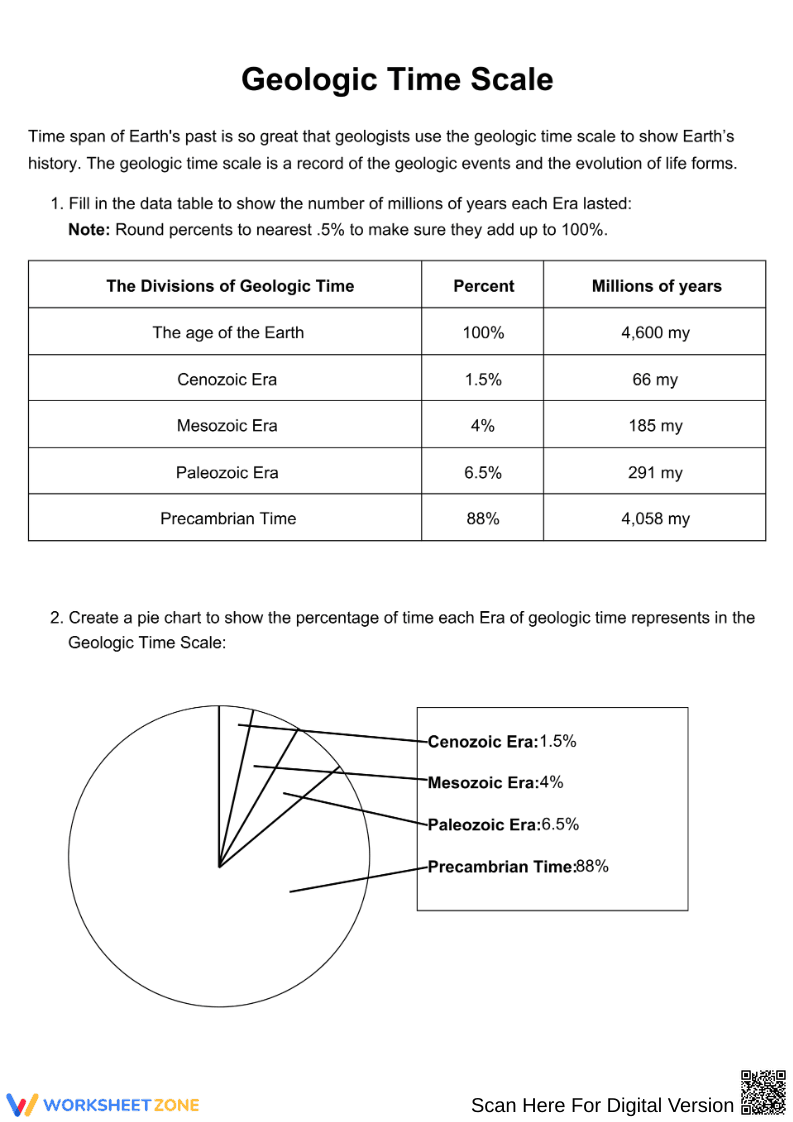
A geologic time scale worksheet that helps students understand how Earth’s 4.6-billion-year history is divided into major eras. Students use percent values and millions-of-years data to complete a table and create a pie chart showing how much of Earth’s history each era represents.
Why Use It:
This worksheet reinforces concepts of geologic time, scale, and proportional reasoning. It improves students’ ability to interpret data, convert between percentages and time spans, and visualize the enormity of Precambrian time compared to later eras. It’s ideal for integrating math skills into Earth science lessons.
How to Use It:
• Assign during lessons on Earth’s history, fossils, or evolution.
• Use as a data-analysis activity where students complete the table using given percentages and time spans.
• Have students create a pie chart to compare eras and understand geologic proportions.
• Pair with a geologic timeline poster or sequencing activity for deeper understanding.
Grade Suitability:
Best suited for Grades 5–9.
• Works well for upper-elementary learners beginning to explore Earth’s history.
• Supports middle-school math-and-science integration, especially in life science and geologic processes.
Target Users:
Teachers, tutors, homeschooling parents, and students studying Earth science, geologic history, or data interpretation.