


Students will use graphs to collect, represent, and analyze data during this lesson. Students are going to:
- collect and display data in bar graphs with suitable labels and headings.
- analyze and contrast data shown in both horizontal and vertical bar graphs.
- How accurate must calculations and measurements be?
- How are mathematical properties of things or processes measured, computed, and/or interpreted?
- What does it mean to evaluate or estimate a numerical quantity?
- What qualifies a tool or approach as suitable for a particular task?
- How can information be presented and arranged to shed light on the relationship between different quantities?
- Data: Information that is gathered.
- Tally Chart: A chart that organizes data using tally marks.
- sticky notes
- student whiteboards
- copies of Inch Grid Paper (M-2-6-1_Inch Grid Paper)
- copies of Favorite Sports graph (M-2-6-1_Favorite Sports Graph and KEY)
- As students complete the math journaling and field trip voting activities using the think-pair-share method, observe and provide informal feedback.
- As students construct and respond to questions regarding both field-trip voting graphs, keep an eye on them and provide informal feedback.
- Assess each student's formal understanding of bar graphs using the Favorite Sports Graph activity (M-2-6-1_Favorite Sports Graph and KEY).
Explicit instruction, modeling, and active engagement
W: During this lesson, students will collect data and use line plots and bar graphs to display it. Additionally, students will study how to decipher data displayed in line and bar plots.
H: Read a recommended book to the class. Talk about comparable decision-making processes that students might have encountered at home, as well as the applications of graphs and surveys.
E: Assign votes to the students by having them write their names on a graph that has been made and posted on the board. Allow them to comment on the votes and their interpretations of the graphs.
R: Make both horizontal and vertical bar graphs using the votes cast by the students. Examine the two graphs and observe that regardless of the type of graph, the data remains the same.
E: Give students the Favorite Sports Graph to complete, and then evaluate their understanding of bar graph interpretation by asking them to answer the accompanying questions.
T: Ask students to create graphs to represent the data and post questions for them to vote on throughout the year. Talk about the findings in math class.
O: This lesson's main focus is on data collection, bar graph construction, and graph interpretation. Students are led through a discussion about graphs using the children's book. After that, the students create bar graphs using their own votes. At the end of the lesson, students interpret bar graphs.
Read Stuart J. Murphy's book The Best Vacation Ever to your students as an introductory exercise. (You can purchase The Best Vacation Ever at most teacher supply stores or online at www.stuartjmurphy.com) Stuart J. Murphy's Tally O'Malley or another grade-appropriate graphing book are good options in case it's not available.
The Best Vacation Ever book summary: A family wants to take a vacation, but they are undecided about where to go. A young girl poses some key questions and charts the responses. Mom wants to visit a peaceful, cool place. The brother and grandmother are seeking amusement. And everyone wants the cat to come along, except Dad. It is not easy to find a place where everyone is happy. Critical thinking skills are developed through learning how to arrange and analyze data.
I'm going to read you a book before we start our graphing exercise. Let's examine the cover. The book is titled The Best Vacation Ever. It was written by Stuart J. Murphy. As a writer, he creates math books for young readers. What do you suppose the subject of our book will be?"
Permit students to discuss the book and offer predictions and ideas. "Those are excellent forecasts! Turn around now and share your best vacation experience with your partner."
"Have any of you ever been on a family trip or vacation where the members couldn't agree on where to go? How did you make your decision?"
Read the book aloud to the class. After reading the book, quiz the students on it. Some examples of questions would be:
"What insights did the book impart to you?"
"What did the story's problem consist of?"
"How did the family monitor their answers?"
Make note of the family's problem-solving techniques as you read the story to the kids. Discuss the story's relevance to your graphing unit with your students.
"We will create graphs, examine data from graphs, and respond to inquiries regarding graphs. Which terms are related to graphing? Write down everything you know about graphs on your whiteboard, using as many terms related to graphing as you can. On your whiteboard, you can write text, numbers, and images."
Permit students to write for three minutes on their whiteboards and to share for two minutes. Before sharing their entries with the class, have students discuss them with a partner (Think-Pair-Share). Ask students to come up with a list of words (such as "tally," "bars," "data," "survey," etc.) related to graphing. Make sure all misunderstandings are dispelled. In their math journals, students can record these terms.
Let’s Vote Activity
Give two sticky notes to every student. Each sticky note should have the student's name on it.
"It's critical to keep information organized. We're going to gather information and see what it can tell us, just like the girl in our story. I am giving each of you two sticky notes. Kindly sign your first name on every sticky note. I need to be able to see your name clearly from the back of the classroom."
Set up your whiteboard as follows while the students are writing their names on the sticky notes:
Example: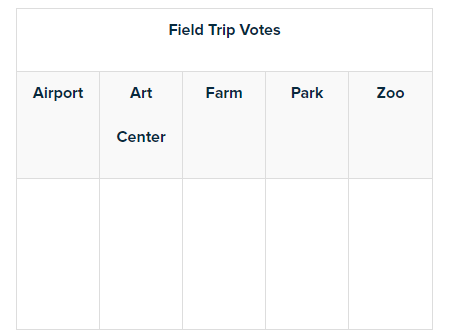
(You can modify the quantity of labels you use on the graph based on the requirements of your students. Only three or four labels were available for selection.) Proceed once all students have inscribed their names on the sticky notes.
"Let's act as though we are heading on a field trip. You will all be able to cast votes for the location of your choice for the field trip. To cast your vote, pick a sticky note. You are free to select any location on our chart. You will stick one of your sticky notes on the graph to indicate where you would like to go on a field trip when I call your name."
Give the students time to attach their sticky notes to the graph. Help students correctly align their sticky notes. Once they have completed the graph, help the students in creating the graph on inch grid paper (M-2-6-1_Inch Grid Paper). Ask questions about the graph to help students understand where to write the labels and title as they construct the graph on the grid paper.
Some examples of questions are:
"What's the graph's name?"
"What does the title explain?"
"On the graph, what are the labels? What information do they give us?"
Now have students count the number of votes for each proposed field trip. For every student who voted for the Art Center and the Airport, mark one box on the grid paper with a pencil. Next, ask students to fill in the appropriate number of boxes for the Farm, Park, and Zoo options that are still available.
Inform students that the Field Trip Votes graph is a bar graph because it shows the number of votes for each field trip, represented by bars. Now ask the students to respond to additional questions centered around graph interpretation using their bar graphs.
Some examples of questions are:
"How many students cast ballots to attend the _____?"
"How many more students than ____ voted for ____?"
"Where should we go on a field trip if we were going to go next week based on the data from our graph?"
If you think the students are prepared to move on to the next activity, keep asking the same questions.
Voting Again
"Congratulations to all who participated in the voting examined the bar graph, and responded to questions based on our data. Using the second sticky note that we've placed on this graph, we will now count our votes. Vote exactly as you did on the first graph, please."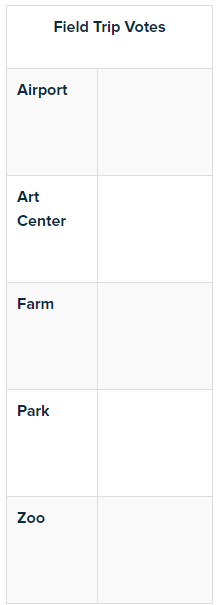
Give the students some time to attach their second sticky note to this graph. Ensure that every student casts their vote in the same manner as on the first graph.
Talk with the students about this graph. "You may want to ask why the labels are placed differently."
"Let's examine this bar graph."
Some examples of questions are:
"How does this graph catch your attention?"
"What is the graph's title?"
"How many students voted to go to the _____?"
"How many more students voted for ____ than ____?"
"Where should we go on a field trip if we were going to go next week based on the data from our graph?"
Introduce the topic of similarities between the two graphs to the students if they haven't already.
Some examples of questions are:
"What do you notice about both similar bar graphs? Describe the differences between the graphs."
"Let's examine the farm's vote totals across the two plots. How have you noticed?" (Identical number, but in a different direction)
Discuss with students the idea that we can choose how we display our data on graphs. However, the data is unaffected by switching from a horizontal to a vertical representation. Students must understand how to read and compare the data on graphs, as well as recognize the components of a graph.
It's crucial to keep in mind that you should ask the following kinds of questions when posing graph-related queries to students:
Read the Graph: These are questions where students are expected to draw straight conclusions from the graph. To find the answer, the student just needs to locate the data on the graph.
Example: "How many individuals would like to go on a field trip to the farm?"
Read Between the Data Items: These are questions that require students to use two or more data points on the graph and take an action based on those two points. Students could compare them, add to them, and so on. OR Students are required to compare information between two different graphs.
Example: "How many more students chose to visit the zoo over the art center in their vote?" OR "How many students chose to visit the park or the farm in their voting?"
Read Beyond the Graph: Questions that encourage students to conclude the graph's data. Students are limited to identifying patterns in the available data and extrapolating future performance based on those patterns. They are unable to see the data as it would appear if the graph continued.
Example: "Which location would we probably vote to visit if we were going on a field trip next week, based on the data from our graph?"
Not on the Graph: These are questions that students are unable to resolve with the data displayed on the graph.
Example: "How many classes take annual field trips to the farm?"
Favorite Sports Graph
Open the M-2-6-1_Favorite Sports Graph and Key file to view the Favorite Sports graph. With your students, go over the title, graph, and data.
"Today, we have discussed bar graphs extensively. Now, you will independently finish a page about bar graphs. I'll assist you if you raise your hand if you have any questions."
Distribute the Favorite Sports graph and use it to gauge how well students understand how to read bar graphs.
Extension:
Utilize the subsequent exercises in your classroom to address your student's needs all year long:
Routine: Question of the Day: Ask students to respond to a question you have posed once a week as they enter the room. Students can indicate their vote with snap cubes or sticky notes. They could arrange the cubes in a stack or place the sticky notes on the board. During the first five minutes of math class, discuss the question's results.
Example: "What is your favorite type of cookie?"
This is how sticky notes or cubes might appear: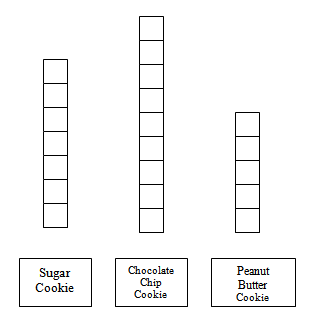
Examples of questions to ask could be
"What is the number of voters' preferred cookie type?"
"Which type of cookie was the least preferred? How are you aware?"
"How many more people prefer sugar cookies to peanut butter cookies?"
“Which two kinds of cookies would be the best to bring for our class to eat if I brought two different kinds? Explain."
Small Group: Create additional graphs that gather student data in your small groups. Students could also create other graphs with the following themes: favorite color, favorite after-school snack, age distribution, number of siblings, and sock color. Together with the students, create a tally chart to collect the data. As you lead the group through the process of creating bar graphs, pose questions to them. Some examples of questions are:
"What labels does this bar graph have?"
"How many bars is the graph going to have? How do you know?"
"What is the expected height of each bar? How do you know?"
Expansion: Have students who need a challenge measure the heights (in inches) of everyone in the class in the fall and again in the spring. With the help of this exercise, you can get experience measuring in inches and make two distinct time-varying graphs.
As an enrichment exercise, ask students to design a survey question with four possible answers. (For instance, what sandwich do you prefer? We've got grilled cheese, ham and cheese, peanut butter and jelly, and bologna. Which season is your favorite? Winter, Autumn, Summer, or Spring.) Students will formulate a question, which they will then pose to their peers to gather information. Students will collect data, graph it, and evaluate the findings.
Creating and Interpreting Bar Graphs (M-2-6-1)
Students will use graphs to collect, represent, and analyze data during this lesson. Students are going to:
- collect and display data in bar graphs with suitable labels and headings.
- analyze and contrast data shown in both horizontal and vertical bar graphs.
