


0
Views
0
Downloads
0.0
0
Save
0 Likes
Constant of Proportionality Exercises
0 Views
0 Downloads
Paste this activity's link or code into your existing LMS (Google Classroom, Canvas, Teams, Schoology, Moodle, etc.).
Students can open and work on the activity right away, with no student login required.
You'll still be able to track student progress and results from your teacher account.
Information
Description
What It Is:
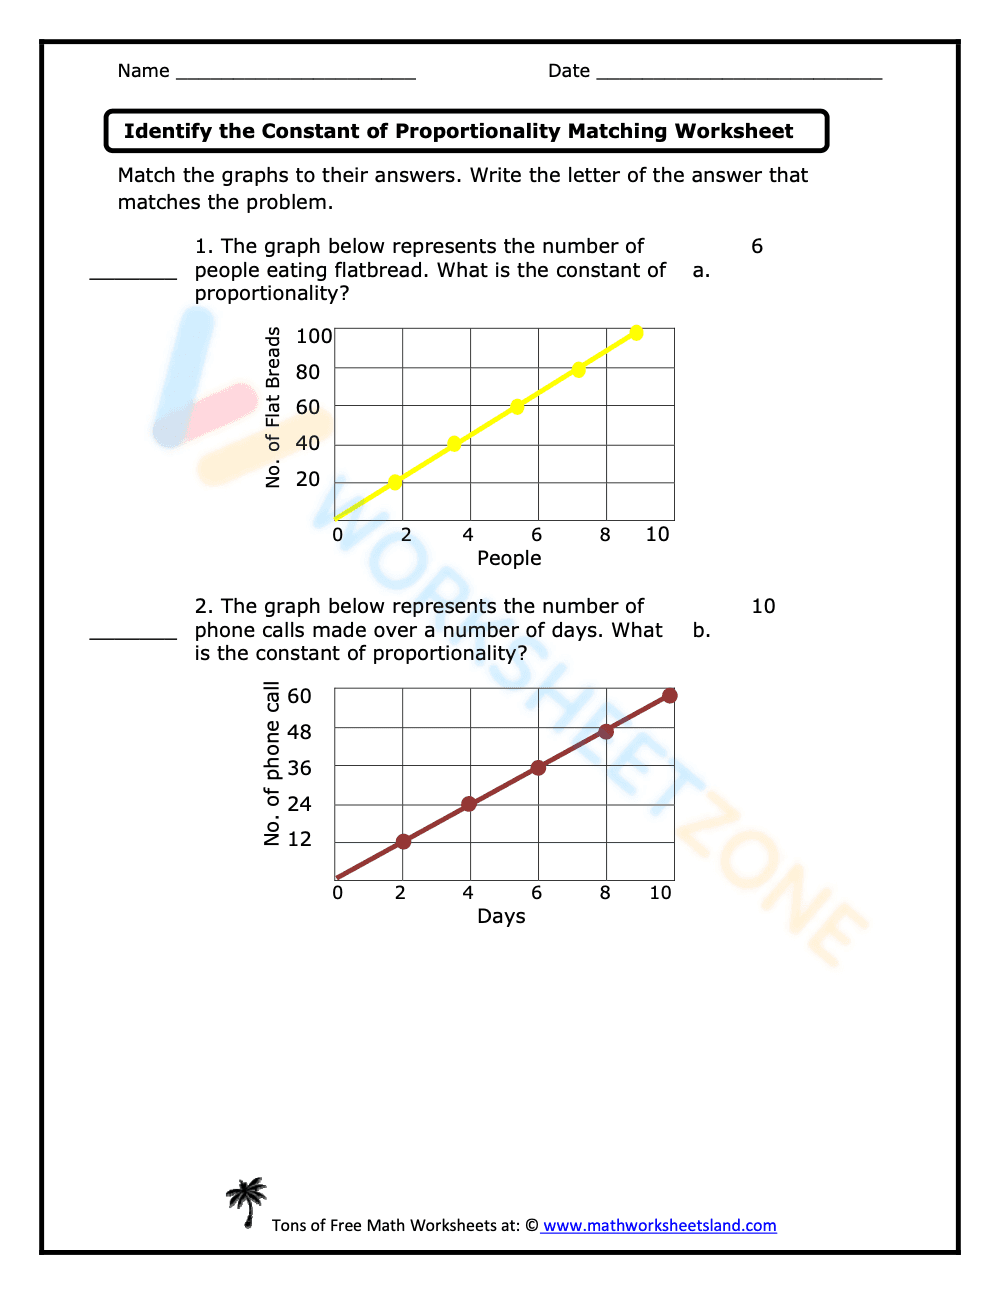
This is a math worksheet focused on identifying the constant of proportionality. It presents two problems, each with a graph representing a proportional relationship. The first graph shows the relationship between the number of people eating flatbread and the number of flatbreads. The second graph shows the relationship between the number of phone calls made and the number of days. Students are required to match each graph to its corresponding constant of proportionality, which are provided as answer choices 'a. 6' and 'b. 10'.
Grade Level Suitability:
This worksheet is suitable for 6th to 7th grade. It focuses on understanding and identifying the constant of proportionality from graphs, a concept typically introduced in middle school mathematics.
Why Use It:
This worksheet helps students practice identifying the constant of proportionality from graphs. It reinforces the concept of proportional relationships and how they are represented visually. It also helps in developing problem-solving skills by requiring students to analyze the graphs and match them to the correct constant of proportionality.
How to Use It:
Students should analyze each graph to determine the constant of proportionality. For each graph, they should identify the unit rate (e.g., how many flatbreads per person or how many phone calls per day). Then, they should match the graph to the correct answer choice (a or b) by writing the letter in the provided blank space.
Target Users:
This worksheet is designed for middle school students learning about proportional relationships and the constant of proportionality. It is suitable for classroom practice, homework assignments, or review activities.