


























Views
Downloads
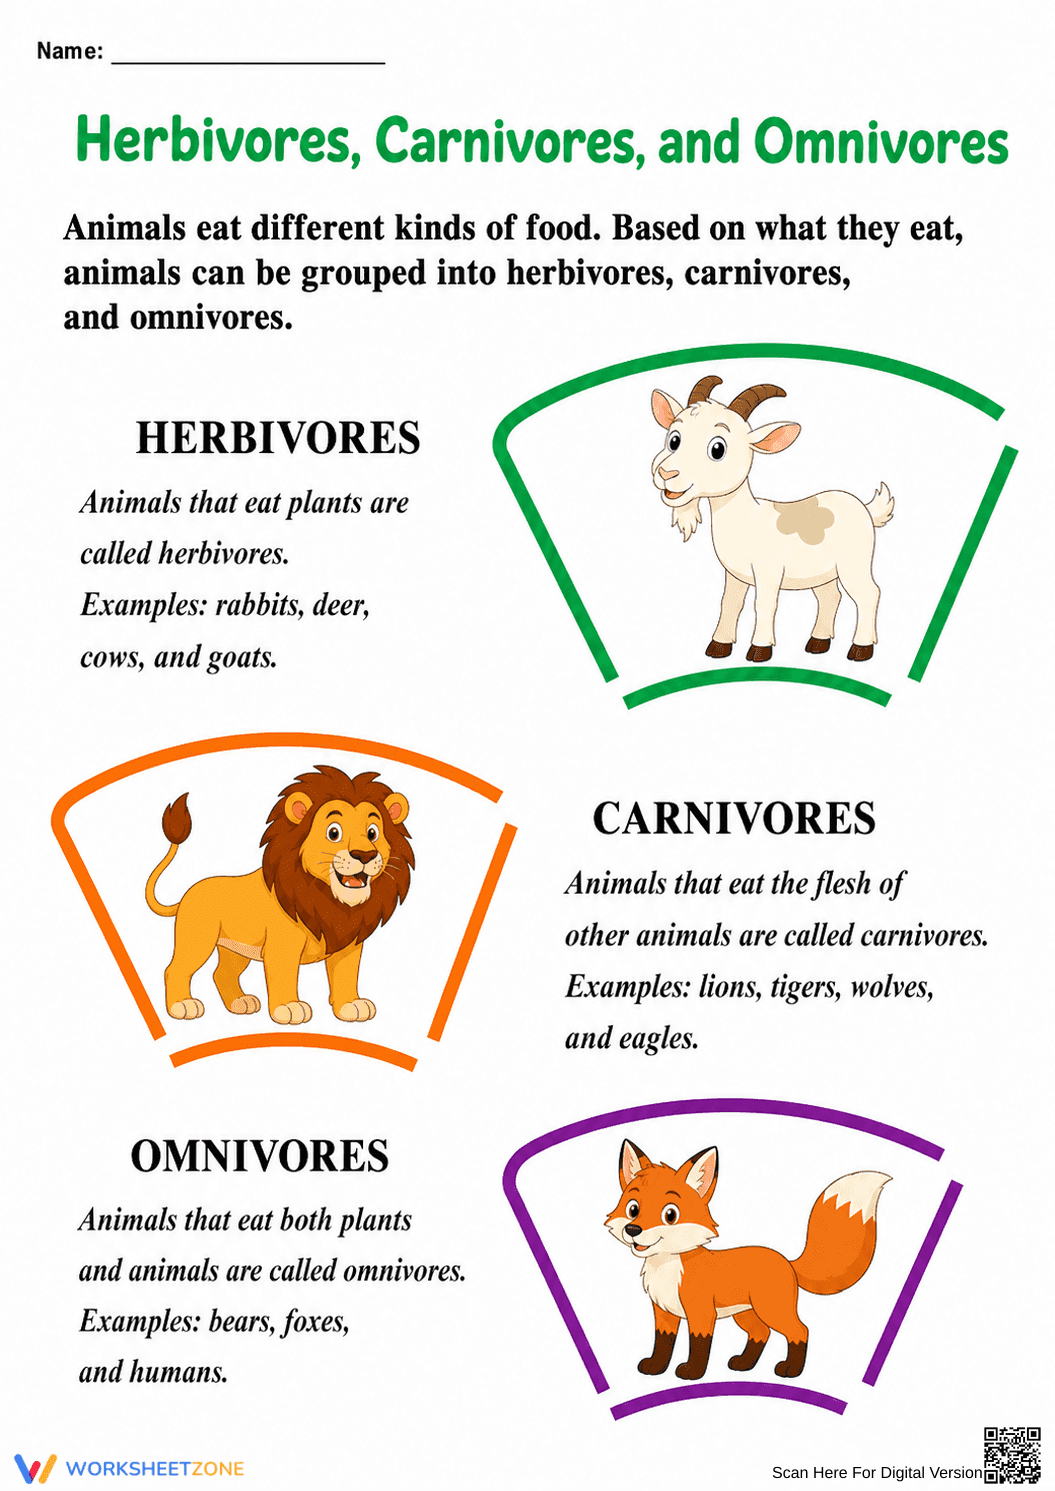

Printable Animal Diet Chart | Grade 2-3 Science
Paste this activity's link or code into your existing LMS (Google Classroom, Canvas, Teams, Schoology, Moodle, etc.).
Students can open and work on the activity right away, with no student login required.
You'll still be able to track student progress and results from your teacher account.
This essential animal diet classification chart helps students master the definitions of herbivores, carnivores, and omnivores. By providing clear descriptions and relatable examples, this resource enables young learners to categorize living things based on their specific food sources and survival needs.
At a Glance
- Grade: 2–3 · Subject: Science
- Standard:
2-LS4-1— Compare the diversity of life in different habitats- Skill Focus: Animal Diet Classification
- Format: 1 page · 0 problems · No answer key · PDF
- Best For: Science notebooks and anchor charts
- Time: 5–10 minutes
What's Inside
This high-quality reference sheet features three distinct sections dedicated to primary animal diet categories. Each section includes a concise definition of the dietary group paired with a list of recognizable examples like deer, tigers, and foxes. Engaging illustrations provide visual cues that enhance memory retention and support visual learners in identifying dietary habits.
Zero-Prep Workflow
The zero-prep design of this chart allows teachers to integrate it into science lessons instantly. First, print the single-page PDF (30 seconds). Next, distribute copies for students to glue into their interactive science notebooks (60 seconds). Finally, lead a quick five-minute review of the definitions. With under two minutes of teacher prep time, it serves as a perfect grab-and-go resource for substitute plans or sudden schedule changes.
Standards Alignment
This resource aligns primarily with 2-LS4-1, which requires students to make observations of plants and animals to compare the diversity of life in different habitats. By understanding diet, students can better analyze how animals fit into their specific ecosystems. Both standard codes can be copied directly into lesson plans, IEP goals, or district curriculum mapping tools.
How to Use It
Use this chart during the explanation phase of a science lesson to formalize student vocabulary after an initial sorting activity. Alternatively, project the chart onto a smartboard as a whole-class anchor chart during direct instruction. Teachers should observe whether students can correctly pair new animals with the categories based on the provided definitions. Expect students to spend 5 to 10 minutes reviewing and referencing this material.
Who It's For
Designed for second and third-grade elementary classrooms, this tool is highly effective for visual learners and ESL students who benefit from clear text-to-image pairings. It naturally pairs with a reading passage about food chains or a hands-on activity involving sorting animal teeth to further investigate how physical traits relate to dietary habits.
The classification of animals into herbivores, carnivores, and omnivores is a foundational concept in the life sciences, serving as the gateway to understanding energy flow within ecosystems. Research from ScienceDirect TpT Analysis (2024) indicates that high-quality visual anchor charts significantly improve student recall of biological definitions in early elementary settings. By providing 2-LS4-1 aligned content that emphasizes the relationship between animal traits and environmental interaction, this resource supports the development of scientific inquiry skills. Students learn to compare the diversity of life in different habitats through structured classification. The inclusion of human beings as omnivores provides a critical connection for young learners, facilitating deeper conceptual engagement with the living world. This definitions chart ensures that students transition from simple observation to structured categorization, a key metric for primary grade science mastery.


