Create a new
Worksheet
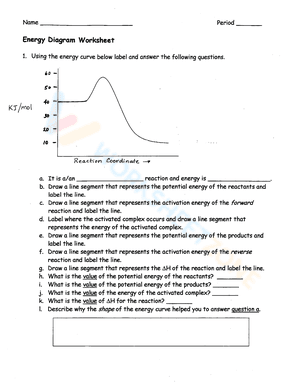
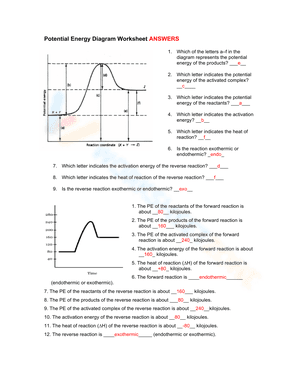
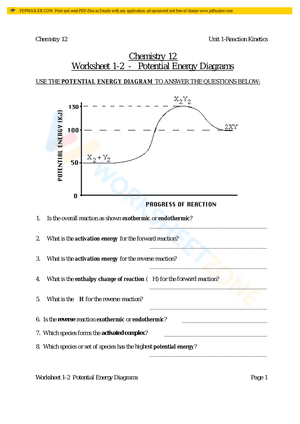
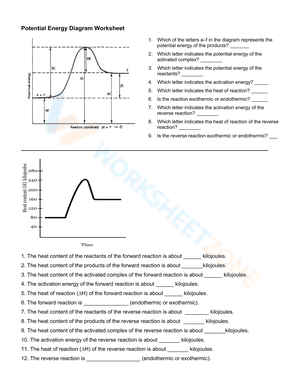
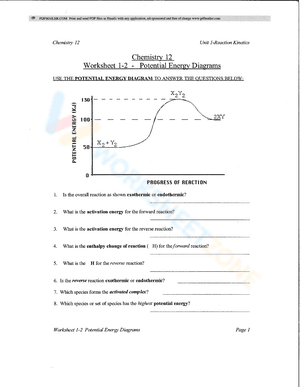
A potential energy diagram, also known as a reaction progress curve, is a visual representation of the energy changes that take place during a chemical reaction. A diagram of potential energy illustrates how a system's potential energy changes as reactants are converted into products. There are potential energy diagrams for endothermic and exothermic reactions. During an exothermic reaction, heat energy is released, resulting in the products having less energy than the reactants. On the other hand, a heat-absorbing reaction is referred to as an endothermic reaction, in which the products have more enthalpy than the reactants. If you are struggling with the problem of understanding potential energy diagrams, please don’t be worried, we have provided plenty of potential energy diagram worksheets for extra practice. By interpreting potential energy diagrams, these extensive worksheets will help you learn more about activation energy, enthalpy changes, and activated complexes. If you are looking for a way to re-teach and provide additional practice when it comes to the potential energy diagram, give our potential energy diagram worksheets a try. We’re sure that these Chemistry worksheets would be a great reinforcement activity.